talk-data.com talk-data.com

Topic

DataViz

Data Visualization

bi charts dashboards

41

tagged

Activity Trend

43 peak/qtr
2020-Q1 2026-Q1

Activities

41 activities · Newest first

fastplotlib: driving scientific discovery through data visualization

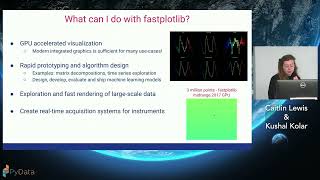
Fast interactive visualization remains a considerable barrier in analysis pipelines for large neuronal datasets. Here, we present fastplotlib, a scientific plotting library featuring an expressive API for very fast visualization of scientific data. Fastplotlib is built upon pygfx, which utilizes the GPU via WGPU, allowing it to interface with modern graphics APIs such as Vulkan for fast rendering of objects. Fastplotlib is non-blocking, allowing for interactivity with data after plot generation. Ultimately, fastplotlib is a general-purpose scientific plotting library that is useful for fast and live visualization and analysis of complex datasets.

Understanding and using color for storytelling in data visualizations

The default color space for computers includes over 16 million colors—an embarrassment of riches that is also a potential quagmire to anyone considering how to best choose colors for visualizations. In this workshop, we will provide a practical framework for working with color. We will start by developing an understanding of color models and color theory, building from these to provide simple but powerful heuristics for color selection that will enable creators of data visualization to enhance the clarity, power, and storytelling of their visualizations. We will conclude with the introduction of tools for working with and selecting color, followed by hands-on activities using these tools. No prior knowledge is needed or assumed, and the only tools you will need is a computer with a web browser and an internet connection.

Meta-Dashboards: Accelerating Geospatial Web Apps Creation with Voilà

The Joint Research Centre has cultivated significant expertise in developing Voilà dashboards for scientific data visualization, resulting in the design and deployment of many real-world web applications. This presentation will highlight our commitment to building a robust Voilà developer community through dedicated training and resource libraries. We will introduce and demonstrate our innovative meta-dashboards, which streamline the creation of complex, multi-page dashboards by automating framework and code generation. A live demonstration will illustrate the ease of building a geospatial application using this tool. We will conclude with a showcase of recently developed Voilà dashboards in areas such as agricultural/biodiversity surveys and air quality monitoring, demonstrating their effectiveness in data exploration and validation.

Searching for My Next Chart

Abstract

As a data visualization practitioner, I frequently draw inspiration from the diverse and rapidly expanding community, particularly through challenges like #TidyTuesday. However, the sheer volume of remarkable visualizations quickly overwhelmed my manual curation methods—from Pinterest boards to Notion pages. This created a significant bottleneck in my workflow, as I found myself spending more time cataloging charts than actively creating them.

In this talk, I will present a RAG (Retrieval Augmented Generation) based retrieval system that I designed specifically for data visualizations. I will detail the methodology behind this system, illustrating how I addressed my own workflow inefficiencies by transforming a dispersed collection of charts into a semantically searchable knowledge base. This project serves as a practical example of applying advanced AI techniques to enhance creative technical work, demonstrating how a specialized retrieval system can significantly improve the efficiency and quality of data visualization creation process.

Carlo Zapponi—From Data to Narrative: Automating Contextual Annotations with AI (Outlier 2025)

Carlo Zapponi—From Data to Narrative: Automating Contextual Annotations with AI (Outlier 2025)

🌟Outlier is a one-of-a-kind data visualization conference hosted by the Data Visualization Society. Outlier brings together all corners of the data visualization community, from artists to business intelligence developers, working in various tech stacks and media. Attendees stretch their creativity and learn from practitioners who they may not otherwise connect with. Learn more on the Outlier website: https://www.outlierconf.com/


📈About the Data Visualization Society: The Data Visualization Society was founded to serve as a professional home for those working across the discipline. Our mission is to connect data visualizers across tech stacks, subject areas, and experience. Advance your skills and grow your network by joining our community: https://www.datavisualizationsociety.org/

Chandni Naidu—Hands on Data Viz with AI Agents—Create Your Own Multi-agent Studio (Outlier 2025)

Chandni Naidu—Hands on: Data Viz with AI Agents—Create Your Own Multi-agent Studio (Outlier 2025)

🌟Outlier is a one-of-a-kind data visualization conference hosted by the Data Visualization Society. Outlier brings together all corners of the data visualization community, from artists to business intelligence developers, working in various tech stacks and media. Attendees stretch their creativity and learn from practitioners who they may not otherwise connect with. Learn more on the Outlier website: https://www.outlierconf.com/


📈About the Data Visualization Society: The Data Visualization Society was founded to serve as a professional home for those working across the discipline. Our mission is to connect data visualizers across tech stacks, subject areas, and experience. Advance your skills and grow your network by joining our community: https://www.datavisualizationsociety.org/

Marco Hernandez—What it takes to create visual stories at the New York Times (Outlier 2025)

Marco Hernandez—What it takes to create visual stories at the New York Times (Outlier 2025)

🌟Outlier is a one-of-a-kind data visualization conference hosted by the Data Visualization Society. Outlier brings together all corners of the data visualization community, from artists to business intelligence developers, working in various tech stacks and media. Attendees stretch their creativity and learn from practitioners who they may not otherwise connect with. Learn more on the Outlier website: https://www.outlierconf.com/


📈About the Data Visualization Society: The Data Visualization Society was founded to serve as a professional home for those working across the discipline. Our mission is to connect data visualizers across tech stacks, subject areas, and experience. Advance your skills and grow your network by joining our community: https://www.datavisualizationsociety.org/

Obinna Iwuji and Chani Wisdom—A Data-Driven Journey Through Nature’s Numbers (Outlier 2025)

Obinna Iwuji and Chani Wisdom—A Data-Driven Journey Through Nature’s Numbers (Outlier 2025)

🌟Outlier is a one-of-a-kind data visualization conference hosted by the Data Visualization Society. Outlier brings together all corners of the data visualization community, from artists to business intelligence developers, working in various tech stacks and media. Attendees stretch their creativity and learn from practitioners who they may not otherwise connect with. Learn more on the Outlier website: https://www.outlierconf.com/


📈About the Data Visualization Society: The Data Visualization Society was founded to serve as a professional home for those working across the discipline. Our mission is to connect data visualizers across tech stacks, subject areas, and experience. Advance your skills and grow your network by joining our community: https://www.datavisualizationsociety.org/

Zan Armstrong—Beyond Explore & Explain Diagnostic Charts and the Question Dimension (Outlier 2025)

Zan Armstrong—Beyond Explore & Explain Diagnostic Charts and the Question Dimension (Outlier 2025)

🌟Outlier is a one-of-a-kind data visualization conference hosted by the Data Visualization Society. Outlier brings together all corners of the data visualization community, from artists to business intelligence developers, working in various tech stacks and media. Attendees stretch their creativity and learn from practitioners who they may not otherwise connect with. Learn more on the Outlier website: https://www.outlierconf.com/


📈About the Data Visualization Society: The Data Visualization Society was founded to serve as a professional home for those working across the discipline. Our mission is to connect data visualizers across tech stacks, subject areas, and experience. Advance your skills and grow your network by joining our community: https://www.datavisualizationsociety.org/

Zane Wolf—Reimagining how we create data viz (Outlier 2025)

Zane Wolf—Reimagining how we create data viz (Outlier 2025)

🌟Outlier is a one-of-a-kind data visualization conference hosted by the Data Visualization Society. Outlier brings together all corners of the data visualization community, from artists to business intelligence developers, working in various tech stacks and media. Attendees stretch their creativity and learn from practitioners who they may not otherwise connect with. Learn more on the Outlier website: https://www.outlierconf.com/


📈About the Data Visualization Society: The Data Visualization Society was founded to serve as a professional home for those working across the discipline. Our mission is to connect data visualizers across tech stacks, subject areas, and experience. Advance your skills and grow your network by joining our community: https://www.datavisualizationsociety.org/

Alberto Cairo, Christopher Laubenthal & Jennifer Roscoe—Opening Remarks (Outlier 2025)

Alberto Cairo, Christopher Laubenthal & Jennifer Roscoe—Opening Remarks (Outlier 2025)

🌟Outlier is a one-of-a-kind data visualization conference hosted by the Data Visualization Society. Outlier brings together all corners of the data visualization community, from artists to business intelligence developers, working in various tech stacks and media. Attendees stretch their creativity and learn from practitioners who they may not otherwise connect with. Learn more on the Outlier website: https://www.outlierconf.com/


📈About the Data Visualization Society: The Data Visualization Society was founded to serve as a professional home for those working across the discipline. Our mission is to connect data visualizers across tech stacks, subject areas, and experience. Advance your skills and grow your network by joining our community: https://www.datavisualizationsociety.org/

Alec Warren—Science Museums as Visual Communication Centers Through XR Experiences (Outlier 2025)

Alec Warren—Science Museums as Visual Communication Centers Through XR Experiences (Outlier 2025)

🌟Outlier is a one-of-a-kind data visualization conference hosted by the Data Visualization Society. Outlier brings together all corners of the data visualization community, from artists to business intelligence developers, working in various tech stacks and media. Attendees stretch their creativity and learn from practitioners who they may not otherwise connect with. Learn more on the Outlier website: https://www.outlierconf.com/


📈About the Data Visualization Society: The Data Visualization Society was founded to serve as a professional home for those working across the discipline. Our mission is to connect data visualizers across tech stacks, subject areas, and experience. Advance your skills and grow your network by joining our community: https://www.datavisualizationsociety.org/

Gabrielle Merite—From making to shaping: Data practitioners as strategic advisors (Outlier 2025)

Gabrielle Merite—From making to shaping: Data practitioners as strategic advisors (Outlier 2025)

🌟Outlier is a one-of-a-kind data visualization conference hosted by the Data Visualization Society. Outlier brings together all corners of the data visualization community, from artists to business intelligence developers, working in various tech stacks and media. Attendees stretch their creativity and learn from practitioners who they may not otherwise connect with. Learn more on the Outlier website: https://www.outlierconf.com/


📈About the Data Visualization Society: The Data Visualization Society was founded to serve as a professional home for those working across the discipline. Our mission is to connect data visualizers across tech stacks, subject areas, and experience. Advance your skills and grow your network by joining our community: https://www.datavisualizationsociety.org/

Gurman Bhatia—The Whole Is Something Besides the Parts (Outlier 2025)

Gurman Bhatia—The Whole Is Something Besides the Parts (Outlier 2025)

🌟Outlier is a one-of-a-kind data visualization conference hosted by the Data Visualization Society. Outlier brings together all corners of the data visualization community, from artists to business intelligence developers, working in various tech stacks and media. Attendees stretch their creativity and learn from practitioners who they may not otherwise connect with. Learn more on the Outlier website: https://www.outlierconf.com/


📈About the Data Visualization Society: The Data Visualization Society was founded to serve as a professional home for those working across the discipline. Our mission is to connect data visualizers across tech stacks, subject areas, and experience. Advance your skills and grow your network by joining our community: https://www.datavisualizationsociety.org/

Jennifer Roscoe—Reimagining the Future of Data Viz (Outlier 2025)

Jennifer Roscoe—Reimagining the Future of Data Viz (Outlier 2025)

🌟Outlier is a one-of-a-kind data visualization conference hosted by the Data Visualization Society. Outlier brings together all corners of the data visualization community, from artists to business intelligence developers, working in various tech stacks and media. Attendees stretch their creativity and learn from practitioners who they may not otherwise connect with. Learn more on the Outlier website: https://www.outlierconf.com/


📈About the Data Visualization Society: The Data Visualization Society was founded to serve as a professional home for those working across the discipline. Our mission is to connect data visualizers across tech stacks, subject areas, and experience. Advance your skills and grow your network by joining our community: https://www.datavisualizationsociety.org/

Lauren Klein and Tanvi Sharma—Rethinking the Origins of Modern Data Visualization (Outlier 2025)

Lauren Klein and Tanvi Sharma—Rethinking the Origins of Modern Data Visualization (Outlier 2025)

🌟Outlier is a one-of-a-kind data visualization conference hosted by the Data Visualization Society. Outlier brings together all corners of the data visualization community, from artists to business intelligence developers, working in various tech stacks and media. Attendees stretch their creativity and learn from practitioners who they may not otherwise connect with. Learn more on the Outlier website: https://www.outlierconf.com/


📈About the Data Visualization Society: The Data Visualization Society was founded to serve as a professional home for those working across the discipline. Our mission is to connect data visualizers across tech stacks, subject areas, and experience. Advance your skills and grow your network by joining our community: https://www.datavisualizationsociety.org/

Mike Cisneros and Alex Velez—The search for meaning when data—and trust—go missing (Outlier 2025)

Mike Cisneros and Alex Velez—The search for meaning when data—and trust—go missing (Outlier 2025)

🌟Outlier is a one-of-a-kind data visualization conference hosted by the Data Visualization Society. Outlier brings together all corners of the data visualization community, from artists to business intelligence developers, working in various tech stacks and media. Attendees stretch their creativity and learn from practitioners who they may not otherwise connect with. Learn more on the Outlier website: https://www.outlierconf.com/


📈About the Data Visualization Society: The Data Visualization Society was founded to serve as a professional home for those working across the discipline. Our mission is to connect data visualizers across tech stacks, subject areas, and experience. Advance your skills and grow your network by joining our community: https://www.datavisualizationsociety.org/

Tatsuo Sugimoto—The Cultural Aspect of Data Visualization in Japan (Outlier 2025)

Tatsuo Sugimoto—The Cultural Aspect of Data Visualization in Japan (Outlier 2025)

🌟Outlier is a one-of-a-kind data visualization conference hosted by the Data Visualization Society. Outlier brings together all corners of the data visualization community, from artists to business intelligence developers, working in various tech stacks and media. Attendees stretch their creativity and learn from practitioners who they may not otherwise connect with. Learn more on the Outlier website: https://www.outlierconf.com/


📈About the Data Visualization Society: The Data Visualization Society was founded to serve as a professional home for those working across the discipline. Our mission is to connect data visualizers across tech stacks, subject areas, and experience. Advance your skills and grow your network by joining our community: https://www.datavisualizationsociety.org/

Liuhuaying Yang—This Is Not Interesting, But It Could Be (Outlier 2025)

Liuhuaying Yang—This Is Not Interesting, But It Could Be (Outlier 2025)

🌟Outlier is a one-of-a-kind data visualization conference hosted by the Data Visualization Society. Outlier brings together all corners of the data visualization community, from artists to business intelligence developers, working in various tech stacks and media. Attendees stretch their creativity and learn from practitioners who they may not otherwise connect with. Learn more on the Outlier website: https://www.outlierconf.com/


📈About the Data Visualization Society: The Data Visualization Society was founded to serve as a professional home for those working across the discipline. Our mission is to connect data visualizers across tech stacks, subject areas, and experience. Advance your skills and grow your network by joining our community: https://www.datavisualizationsociety.org/

Nadieh Bremer—CHART Designing Creative Data Visualizations from Charts to Art (Outlier 2025)

Nadieh Bremer—CHART Designing Creative Data Visualizations from Charts to Art (Outlier 2025)

🌟Outlier is a one-of-a-kind data visualization conference hosted by the Data Visualization Society. Outlier brings together all corners of the data visualization community, from artists to business intelligence developers, working in various tech stacks and media. Attendees stretch their creativity and learn from practitioners who they may not otherwise connect with. Learn more on the Outlier website: https://www.outlierconf.com/


📈About the Data Visualization Society: The Data Visualization Society was founded to serve as a professional home for those working across the discipline. Our mission is to connect data visualizers across tech stacks, subject areas, and experience. Advance your skills and grow your network by joining our community: https://www.datavisualizationsociety.org/