Behind-the-scenes stories from working on Grafana Lab's Database Observability project: unexpected quirks and what we learned along the way. A little technical, a lot of reflection, and hopefully a good story.
 talk-data.com
Topic
Grafana
35
tagged
Activity Trend
Top Events
Demo with Grafana and Streambased Iceberg architectures (Tom from Streambased)
Grafana's magic comes from seeing what's happening right now and instantly comparing it to everything that has happened before. Real-time data lets teams spot anomalies the moment they emerge. Long-term data reveals whether those anomalies are new, seasonal, or the same gremlins haunting your system every quarter. But actually building this capability? That's where everything gets messy. Today's dashboards are cobbled together from two very different worlds: Long-term data living in lakes and warehouses; Real-time streams blasting through Kafka or similar systems. These systems rarely fit together cleanly, which forces dashboard developers to wrestle with: Differing processing concepts - What does SQL even mean on a stream? Inconsistent governance - Tables vs. message schemas, different owners, different rules; Incomplete history - Not everything is kept forever, and you never know what will vanish next; Maintenance drift - As pipelines evolve, your ETL always falls behind. But what if there were no separation at all? Join us for a deep dive into a new, unified approach where real-time and historical data live together in a single, seamless dataset. Imagine dashboards powered by one source of truth that stretches from less than one second ago to five, ten, or even fifteen years into the past, without stitching, syncing, or duct-taping systems together. Using Apache Kafka, Apache Iceberg, and a modern architectural pattern that eliminates the old 'batch vs. stream' divide, we'll show how to: Build Grafana dashboards that just work with consistent semantics end-to-end; Keep every message forever without drowning in storage costs; Query real-time and historical data with the same language, same governance, same everything; Escape the ETL death spiral once and for all. If you've ever wished your dashboards were both lightning-fast and infinitely deep, this talk will show you how close that future really is.

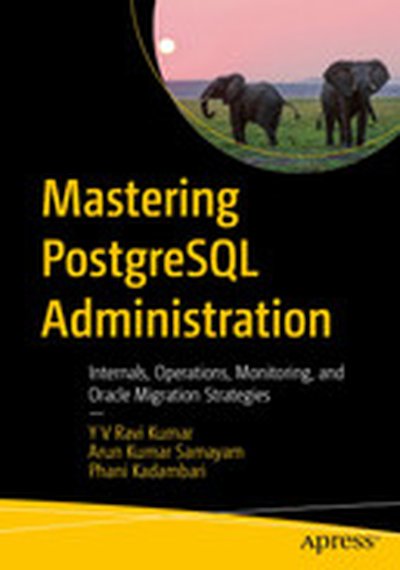
This book is your one-stop resource on PostgreSQL system architecture, installation, management, maintenance, and migration. It will help you address the critical needs driving successful database management today: reliability and availability, performance and scalability, security and compliance, cost-effectiveness and flexibility, disaster recovery, and real-time analytics—all in one volume. Each topic in the book is thoroughly explained by industry experts and includes step-by-step instructions for configuring the features, a discussion of common issues and their solutions, and an exploration of real-world scenarios and case studies that illustrate how concepts work in practice. You won't find the book's comprehensive coverage of advanced topics, including migration from Oracle to PostgreSQL, heterogeneous replication, and backup & recovery, in one place—online or anywhere else. What You Will Learn Install PostgreSQL using source code and yum installation Back up and recover Migrate from Oracle database to PostgreSQL using ora2pg utility Replicate from PostgreSQL to Oracle database and vice versa using Oracle GoldenGate Monitor using Grafana, PGAdmin, and command line tools Maintain with VACUUM, REINDEX, etc. Who This Book Is For Intermediate and advanced PostgreSQL users, including PostgreSQL administrators, architects, developers, analysts, disaster recovery system engineers, high availability engineers, and migration engineers
Sifting through the deluge of data from your distributed systems can be overwhelming – but it doesn’t have to be. Join us to see how Traces Drilldown in Grafana, powered by Tempo, can simplify complex troubleshooting, helping you quickly detect latency issues, identify error trends, and spot anomalies – all without having to learn yet another query language.
Metric analysis is hard. For engineers and for machines. I'll show you how to make it easy. In this talk, I'll share simple steps to boost your Grafana dashboard's UX and ML capabilities. Want to automate your Grafana analysis? Join my session to find out how.
In this session, we’ll walk through how Apache Flink was used to enable near real-time operational insights using manufacturing IIoT Data sets. The goal: deliver actionable KPIs to production teams with sub-30-second latency, using streaming data pipelines built Kafka, Flink and Grafana. We’ll cover the key architectural patterns that made this possible, including handling structured data joins, managing out-of-order events, and integrating with downstream systems like PostgreSQL and Grafana. We’ll also share real-world performance benchmarks, lessons learned from scaling tests, and practical considerations for deploying Flink in a production-grade, low-latency analytics pipeline. The session will also include a live demo
If you're building Flink-based solutions for time-sensitive operations—whether in manufacturing, IoT, or other domains—this talk will provide proven insights from the field.
DISCLAIMER We don't cater to attendees under the age of 18. If you want to host or speak at a meetup, please email [email protected]
Gardening meets Grafana in this beginner-friendly talk. Marie will walk you through building a complete IoT monitoring pipeline using a soil moisture sensor, Arduino-compatible hardware, and Grafana Cloud. Setting up the tech: Arduino, Wi-Fi modules, and soil sensors. Pushing metrics to the cloud with Prometheus and Grafana. Designing the dashboard.

In this session, discover how effective data movement is foundational to successful GenAI implementations. As organizations rush to adopt AI technologies, many struggle with the infrastructure needed to manage the massive influx of unstructured data these systems require. Jim Kutz, Head of Data at Airbyte, draws from 20+ years of experience leading data teams at companies like Grafana, CircleCI, and BlackRock to demonstrate how modern data movement architectures can enable secure, compliant GenAI applications. Learn practical approaches to data sovereignty, metadata management, and privacy controls that transform data governance into an enabler for AI innovation. This session will explore how you can securely leverage your most valuable asset—first-party data—for GenAI applications while maintaining complete control over sensitive information. Walk away with actionable strategies for building an AI-ready data infrastructure that balances innovation with governance requirements.
Explore the powerful capabilities behind Grafana dashboards, including metrics with Mimir, logs with Loki, and tracing with Tempo. Understand how to scale and integrate these tools effectively within your cloud-native ecosystem.
Learn how to create highly responsive and readable dashboards, automatically generated from code. Viacheslav will showcase performance monitoring for YouTrack, the JVM, and Nginx using Grafana as Code — ideal for developers of self-hosted systems and Grafana enthusiasts.
The Kubernetes observability talk will cover how to monitor, trace, and troubleshoot applications in a Kubernetes environment. It will highlight key tools like Prometheus, Thanos, Grafana, and OpenTelemetry for tracking metrics, logs, and distributed traces. Topics include improving visibility into clusters and microservices, detecting anomalies, and ensuring reliability. The session will focus on best practices for proactive observability and efficient debugging to maintain the health of cloud-native applications.
In the world of observability, metrics and logs are the usual suspects for monitoring system health and diagnosing issues. But what happens when you don't know what to look for in advance? We tackle this challenge by incorporating business-critical events into our observability stack. Join me for this talk as I delve into how events can fill the gaps left by traditional metrics and logs. I'll share our journey in identifying which events are worth storing and how our technical setup evolved from periodic PostgreSQL pulls to real-time streaming with AWS Firehose. You'll see real-world examples through our Grafana dashboards and learn how this approach allows us to perform ad-hoc analyses spanning over two years without incurring huge costs.
Half a year ago, my team at Trade Republic fully migrated our observability stack from Datadog to LGTM (Loki, Grafana, Tempo, Mimir). Operations after migration are as important as the migration itself, involving ongoing challenges such as performance and scalability issues, bugs, and incidents. In this talk, I’ll share our experiences from the past six months, detailing the challenges we faced and the valuable lessons we learned while using Grafana tools. Join us to gain insights into the practical aspects of managing and optimising an observability stack in a dynamic environment.
Hidden from our eyes, aircraft in our skies are constantly transmitting data. Join us as we use some simple tech and the power of open source to fly through this data set. In this talk, see a Raspberry Pi, Apache Kafka, Apache Druid, and Grafana coming together for real-time data production, transport, OLAP, and interactive visualisation.
Hidden from our eyes, aircraft in our skies are constantly transmitting data. Join us as we use some simple tech and the power of open source to fly through this data set. In this talk, see a Raspberry Pi, Apache Kafka, Apache Druid, and Grafana coming together for real-time data production, transport, OLAP, and interactive visualisation.
Setting up the observability strategy for your applications requires instrumenting your code. In some cases, this task can be really tedious. Thanks to revolutionary technologies like eBPF, enabling this process requires minimal effort. Join us in this session and discover how, with Grafana Beyla, you can achieve zero-code instrumentation for your applications.
In the current environment, cost awareness on top of a great developer experience is more relevant than ever. As an answer to that, at Trade Republic, we have decided to re-evaluate the cost-to-use of our observability offering and ruled against continuing the path forward with Datadog. In this talk I will provide an overview of our mission to migrate to an alternative stack, which outcome we have so far and what we have learned.

Learn Grafana 10.x is your essential guide to mastering the art of data visualization and monitoring through interactive dashboards. Whether you're starting from scratch or updating your knowledge to Grafana 10.x, this book walks you through installation, implementation, data transformation, and effective visualization techniques. What this Book will help me do Install and configure Grafana 10.x for real-time data visualization and analytics. Create and manage insightful dashboards with Grafana's enhanced features. Integrate Grafana with diverse data sources such as Prometheus, InfluxDB, and Elasticsearch. Set up dynamic templated dashboards and alerting systems for proactive monitoring. Implement Grafana's user authentication mechanisms for enhanced security. Author(s) None Salituro is a seasoned expert in data analytics and observability platforms with extensive experience working with time-series data using Grafana. Their practical teaching approach and passion for sharing insights make this book an invaluable resource for both newcomers and experienced users. Who is it for? This book is perfect for business analysts, data visualization enthusiasts, and developers interested in analyzing and monitoring time-series data. Whether you're a newcomer or have some background knowledge, this book offers accessible guidance and advanced tips suitable for all levels. If you're aiming to efficiently build and utilize Grafana dashboards, this is the book for you.