talk-data.com talk-data.com

Topic

observability

41

tagged

Activity Trend

13 peak/qtr
2020-Q1 2026-Q1

Activities

41 activities · Newest first

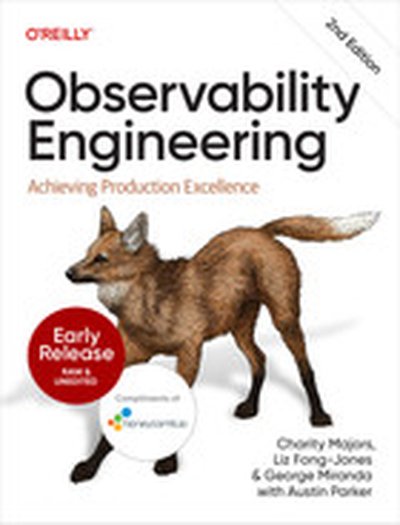
Observability Engineering, 2nd Edition

Observability is the only way to engineer, manage, and improve the business-critical systems that customers depend on every day—and as the complexity of software grows, so does the need for observability. With this thoroughly revised second edition, authors Charity Majors, Liz Fong-Jones, and George Miranda take inventory of the current state of the field and explain how practitioners can evolve their observability practices from collecting separate, disparate signals to unified data workflows. This book is for any software engineering team, large or small, that must understand the unique customer experience in order to ship quality code and features that customers want, at the right velocity. You'll discover the value that observable systems bring and learn concrete steps you can follow to achieve an observability-driven development practice yourself. And four completely new chapters explore recent trends such as large language models, frontend observability, cost optimization/performance engineering, and practical open source tooling. Understand the impact observability has across the entire software development lifecycle Learn how and why different functional teams use observability with service-level objectives Implement modern observability practices in your organization Maximize the cost-effectiveness of observability tooling Produce quality code for context-aware system debugging and maintenance Use data-rich analytics to quickly find answers when maintaining site reliability

A panel discussion on taking AI infrastructure from prototypes to production, covering GPU scheduling, model orchestration, observability, governance, and scaling across hybrid environments. Discuss architectural trade-offs, best practices, and organizational realities of supporting production-grade AI.

Arno will explore the evolution of search technology in the age of AI. From large language models and “LLM Wars” to enterprise-scale challenges in observability and security, he’ll share practical insights on how Elastic customers are experimenting with AI, what works today, and why the answer often depends on context.

At Criteo, we’ve relied on automatic aggregations for years. “Automatic aggregation” is the name we give to a system of recording rules that matches most metrics and removes certain dimensions, such as the instance emitting the metric, to reduce the cardinality (i.e., the number of metrics) and thus makes queries faster. What started as a workaround has become a key part of how we ensure backend stability and reliability at scale, with hundreds of millions of active metrics, all without requiring users to write a single recording rule. It also significantly reduces the cost of metrics storage. Internally, we call this approach zero-effort Observability, as most teams don’t have to write/maintain recording rules. In this talk, Raphael will explain how our approach to automatic aggregations has evolved over time and how we’ve adapted it to fit naturally into our Prometheus-based stack. He will share the different implementations we’ve tried, the lessons we’ve learned, and how our latest version takes advantage of recent improvements in Prometheus (new type label).

Prometheus has become the go-to standard for metrics-based monitoring, but as environments grow in complexity and scale, teams often find themselves hitting its operational limits, especially around cardinality and long-term storage. This talk explores how VictoriaMetrics builds on Prometheus fundamentals to offer a more scalable and efficient alternative for teams managing high-ingestion workloads and demanding retention needs, without abandoning the familiar Prometheus ecosystem. I’ll dive into how VictoriaMetrics supports Prometheus-compatible scrape configurations and exporters, allowing seamless integration with existing workflows. The session will showcase practical strategies for setting up and tuning scrape jobs, managing cardinality through label analysis and relabeling, and using VictoriaMetrics’ UI and tools to gain insight into metric usage patterns. This talk is tailored for advanced users eager to push the boundaries of Prometheus-based observability, demonstrating how the core philosophy of Prometheus can be extended and elevated through the integration of high-performance systems like VictoriaMetrics.

A single-node version of VictoriaLogs can handle hundreds of terabytes of logs. What if this isn't enough for you? Then the cluster version of VictoriaLogs comes to the rescue! It can scale to tens of petabytes of logs. This talk dives into the architectural details of the VictoriaLogs cluster, which explains how it achieves linear horizontal scalability for both data ingestion and querying paths. There is no magic - the cluster architecture is clear and quite simple. The talk also covers typical use cases for the VictoriaLogs cluster when a single-node version isn't enough.