Does size matter? When it comes to datasets, the conventional wisdom seems to be a resounding, "Yes!" But what about small datasets? Small- and mid-sized businesses and nonprofits, especially, often have limited web traffic, small email lists, CRM systems that can comfortably operate under the free tier, and lead and order counts that don't lend themselves to "big data" descriptors. Even large enterprises have scenarios where some datasets easily fit into Google Sheets with limited scrolling required. Should this data be dismissed out of hand, or should it be treated as what it is: potentially useful? Joe Domaleski from Country Fried Creative works with a lot of businesses that are operating in the small data world, and he was so intrigued by the potential of putting data to use on behalf of his clients that he's mid-way through getting a Master's degree in Analytics from Georgia Tech! He wrote a really useful article about the ins and outs of small data, so we brought him on for a discussion on the topic! This episode's Measurement Bite from show sponsor Recast is an explanation of synthetic controls and how they can be used as counterfactuals from Michael Kaminsky! For complete show notes, including links to items mentioned in this episode and a transcript of the show, visit the show page.
 talk-data.com
Topic
Google Sheets
13
tagged
Activity Trend
Top Events
Ever tried building a credit risk model when your data lives in Google Sheets and your loan statuses are about as reliable as weather forecasts? You'll learn practical data science lessons about surviving data quality issues, the critical importance of target variable definition, adding genetics to feature selection algorithms, and how engineered transactional features can transform your predictions from probably fine to we actually know what we're doing. We’ll show how classical ML approaches like logistic regression and XGBoost remain highly effective for binary classification problems, proving that sometimes the fundamentals work better than the latest AI trends. Perfect for anyone who's ever wondered how machine learning works when your data isn't clean, your labels aren't perfect, and your stakeholders want results yesterday.
Beaucoup d’organisations parlent de créer une Source Unique de Vérité (SSOT), mais rares sont celles qui parviennent à en faire une réalité durable. Dans cette session, Vira Douangphouxay, Director of Analytics Engineering chez Vestiaire Collective, partagera comment son équipe a conçu et fait évoluer une initiative SSOT depuis zéro - en équilibrant scalabilité technique, alignement inter-équipes et gouvernance à long terme.
Vous découvrirez des retours d’expérience concrets : comment prioriser les actifs les plus critiques, structurer les responsabilités entre les équipes BI, produit et métier, et intégrer les bonnes pratiques dans des outils comme Coalesce, Snowflake, Catalog et Google Sheets.
Tristan Mayer, General Manager Catalog chez Coalesce, interviendra également pour apporter un éclairage complémentaire sur les bonnes pratiques outillées et les leçons tirées d'autres entreprises du secteur.
Que vous débutiez votre projet SSOT ou cherchiez à le pérenniser, cette session vous offrira une vision pragmatique de ce qu’il faut vraiment pour unifier vos définitions de données, réduire les incohérences de reporting et restaurer la confiance dans vos analyses.
If your job search feels like tab-hell—applications everywhere, prep scattered, follow-ups forgotten—this episode is your reset. I walk you through three small but mighty AI agents you can build in an afternoon: • Application Tracker Agent — paste a job link → extract company, title, pay, location → auto-log to Notion/Sheets → set a 7-day follow-up. • Interview Prep Agent — feed the JD + your resume → get tailored behavioral questions, SQL/case drills, and a tight “Tell me about yourself.” • Follow-Up Agent — generate a thank-you in your voice, log the interview date, and nudge you if you haven’t heard back. You’ll learn the agent essentials—planning, memory, feedback loops—plus a copy-and-paste framework, example prompts, and quality checks so your agents save time instead of making noise. Chapters below. Show notes include my working templates, prompts, and affiliate tools I actually use (Riverside for recording, RSS.com for hosting, Sider for research). Rate the show if this helped—it means a lot. Primary keywords: ai agents, job search, interview prep, application tracking, follow-up emails Secondary keywords: Notion, Google Sheets, SQL interview, behavioral questions, automation, productivity, podseo, career tools
Links & Resources Recording Partner: Riverside → Sign up here (affiliate)Host Your Podcast: RSS.com (affiliate )Research Tools: Sider.ai (affiliate)Join the Newsletter: Free Email Newsletter to receive practical AI tools weekly.Join the Discussion (comments hub): https://mukundansankar.substack.com/notes🔗 Connect with Me:Website: Data & AI with MukundanTwitter/X: @sankarmukund475LinkedIn: Mukundan SankarYouTube: Subscribe
Working with data in grids or spreadsheets is great for collaboration as there are many different tools to view and edit the files. Data science workflows often include packages like openpyxl to create, load, edit, and export spreadsheets that then are shared with others who can use other tools like Excel, Google Sheets, or IDEs to view them. The new Python in Excel feature as well as the Anaconda Toolbox add-in provides the tools to run Python directly in cells in a spreadsheet, making it easier for Pythonistas to access and collaborate on code. This talk will introduce how these features work, demo collaborating on Python code in a worksheet, and talk about some case studies where these tools have been used to teach and collaborate with Python.
Yearning for insights from your spreadsheets? The combination of Looker and Google Workspace is your data dream team. In this session you will learn how to automatically generate Google Slides from Looker, how to generate reports from Google Sheets, and bring business intelligence into the flow of work. Leverage AI to find trends and generate summaries in seconds, and build interactive dashboards that respond to your clicks.
Click the blue “Learn more” button above to tap into special offers designed to help you implement what you are learning at Google Cloud Next 25.
No matter how fancy your modern data stack is, managers still use Spreadsheets!
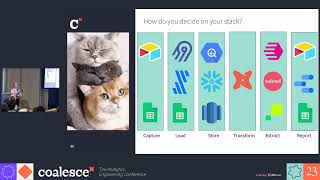
Lauren Benezra has been volunteering with a local cat rescue since 2018. She recently took on the challenge of rebuilding their data stack from scratch, replacing a Jenga tower of incomprehensible Google Sheets with a more reliable system backed by the Modern Data Stack. By using Airtable, Airbyte, BigQuery, dbt Cloud and Census, her role as Foster Coordinator has transformed: instead of digging for buried information while wrangling cats, she now serves up accurate data with ease while... well... wrangling cats.
Viewers will learn that it's possible to run an extremely scalable and reliable stack on a shoestring budget, and will come away with actionable steps to put Lauren's hard-won lessons into practice in their own volunteering projects or as the first data hire in a tiny startup.
Speakers: Lauren Benezra, Senior Analytics Engineer, dbt Labs
Register for Coalesce at https://coalesce.getdbt.com/
Can cold messaging really land you your first data job? Even without experience? In this episode, Avery sits down with logistics Data Analyst Asa Howard to discuss how he landed his first data job with a simple cold messaging strategy.
🌟 Join the data project club!
“25OFF” to get 25% off (first 50 members).
📊 Come to my next free “How to Land Your First Data Job” training
🏫 Check out my 10-week data analytics bootcamp
Asa’s Links:
Connect on LinkedIn Waitlist for Google Sheets course
Timestamps:
(3:22) - Asa realizes he needs a career pivot
(5:21) - What a Solutions Engineer does (Logistics Analyst)
(10:21) - System he used to land his job
(14:24) - Cold message template you can steal
(18:01) - What tools he uses on day to day
(24:37) - Google Sheets vs Excel
Connect with Avery:
📺 Subscribe on YouTube: https://www.youtube.com/c/AverySmithDataCareerJumpstart/videos 🎙Listen to My Podcast: https://podcasts.apple.com/us/podcast/data-career-podcast/id1547386535 👔 Connect with me on LinkedIn: https://www.linkedin.com/in/averyjsmith/ 📸 Instagram: https://www.instagram.com/datacareerjumpstart/ 🎵 TikTok: https://www.tiktok.com/@verydata?
Mentioned in this episode: Join the last cohort of 2025! The LAST cohort of The Data Analytics Accelerator for 2025 kicks off on Monday, December 8th and enrollment is officially open!
To celebrate the end of the year, we’re running a special End-of-Year Sale, where you’ll get: ✅ A discount on your enrollment 🎁 6 bonus gifts, including job listings, interview prep, AI tools + more
If your goal is to land a data job in 2026, this is your chance to get ahead of the competition and start strong.
👉 Join the December Cohort & Claim Your Bonuses: https://DataCareerJumpstart.com/daa https://www.datacareerjumpstart.com/daa
Tell your story and show it with data, using free and easy-to-learn tools on the web. This introductory book teaches you how to design interactive charts and customized maps for your website, beginning with simple drag-and-drop tools such as Google Sheets, Datawrapper, and Tableau Public. You'll also gradually learn how to edit open source code templates like Chart.js, Highcharts, and Leaflet on GitHub. Hands-On Data Visualization takes you step-by-step through tutorials, real-world examples, and online resources. This practical guide is ideal for students, nonprofit organizations, small business owners, local governments, journalists, academics, and anyone who wants to take data out of spreadsheets and turn it into lively interactive stories. No coding experience is required. Build interactive charts and maps and embed them in your website Understand the principles for designing effective charts and maps Learn key data visualization concepts to help you choose the right tools Convert and transform tabular and spatial data to tell your data story Edit and host Chart.js, Highcharts, and Leaflet map code templates on GitHub Learn how to detect bias in charts and maps produced by others
Linhda joins Kyle today to talk through A.C.I.D. Compliance (atomicity, consistency, isolation, and durability). The presence of these four components can ensure that a database's transaction is completed in a timely manner. Kyle uses examples such as google sheets, bank transactions, and even the game rummy cube. Thanks to this week's sponsors: Monday.com - Their Apps Challenge is underway and available at monday.com/dataskeptic
Brilliant - Check out their Quantum Computing Course, I highly recommend it! Other interesting topics I've seen are Neural Networks and Logic. Check them out at Brilliant.org/dataskeptic

Whether we use Data Studio, Excel, Google Sheets, Tableau, R, some other platform, or (most likely) some combination of platforms, at the end of the day, as analysts, a core mechanism we use for communicating with our stakeholders is data visualization. The difference between an excellent visualization and a mediocre one can easily be the difference between whether a stakeholder understands and acts upon the data or whether she, instead, struggles to internalize the information and actually put it to use. In this session, Tim will walk through some of the neuroscience and psychology that underpins best practices in data visualization, as well as provide platform-agnostic tactical tips that put these principles to effective use.

Did fake Twitter accounts help sway a presidential election? What can Facebook and Reddit archives tell us about human behavior? In Mining Social Media, senior BuzzFeed reporter Lam Thuy Vo shows you how to use Python and key data analysis tools to find the stories buried in social media. Whether you’re a professional journalist, an academic researcher, or a citizen investigator, you’ll learn how to use technical tools to collect and analyze data from social media sources to build compelling, data-driven stories. Learn how to: •Write Python scripts and use APIs to gather data from the social web •Download data archives and dig through them for insights •Inspect HTML downloaded from websites for useful content •Format, aggregate, sort, and filter your collected data using Google Sheets •Create data visualizations to illustrate your discoveries •Perform advanced data analysis using Python, Jupyter Notebooks, and the pandas library •Apply what you’ve learned to research topics on your own Social media is filled with thousands of hidden stories just waiting to be told. Learn to use the data-sleuthing tools that professionals use to write your own data-driven stories.