Provides conceptual information about the SAS programming language, as well as step-by-step examples that illustrate the concepts.
Activities tracked
2118
Collection of O'Reilly books on Data Science.
Sessions & talks
Showing 1626–1650 of 2118 · Newest first
Provides conceptual information about the SAS programming language, as well as step-by-step examples that illustrate the concepts.

Today, more mediated information is available to more people than at any other time in human history. New and revitalized sense-making strategies multiply in response to the challenges of "cutting through the clutter" of competing narratives and taming the avalanche of information. Data miners, "sentiment analysts," and decision markets offer to help bodies of data "speak for themselves"—making sense of their own patterns so we don’t have to. Neuromarketers and body language experts promise to peer behind people’s words to see what their brains are really thinking and feeling. New forms of information processing promise to displace the need for expertise and even comprehension—at least for those with access to the data. Infoglut explores the connections between these wide-ranging sense-making strategies for an era of information overload and "big data," and the new forms of control they enable. Andrejevic critiques the popular embrace of deconstructive debunkery, calling into question the post-truth, post-narrative, and post-comprehension politics it underwrites, and tracing a way beyond them.
Solar Energy Forecasting and Resource Assessment is a vital text for solar energy professionals, addressing a critical gap in the core literature of the field. As major barriers to solar energy implementation, such as materials cost and low conversion efficiency, continue to fall, issues of intermittency and reliability have come to the fore. Scrutiny from solar project developers and their financiers on the accuracy of long-term resource projections and grid operators’ concerns about variable short-term power generation have made the field of solar forecasting and resource assessment pivotally important. This volume provides an authoritative voice on the topic, incorporating contributions from an internationally recognized group of top authors from both industry and academia, focused on providing information from underlying scientific fundamentals to practical applications and emphasizing the latest technological developments driving this discipline forward. The only reference dedicated to forecasting and assessing solar resources enables a complete understanding of the state of the art from the world’s most renowned experts. Demonstrates how to derive reliable data on solar resource availability and variability at specific locations to support accurate prediction of solar plant performance and attendant financial analysis. Provides cutting-edge information on recent advances in solar forecasting through monitoring, satellite and ground remote sensing, and numerical weather prediction.
This book helps readers obtain an in-depth understanding of statistical theory by working on and reviewing solutions to interesting and challenging exercises of practical importance. Unlike similar books, this one incorporates many exercises that apply to real-world settings and provides much more thorough solutions. The exercises and selected detailed solutions cover from basic probability theory through to the theory of statistical inference. By mastering the theoretical statistical strategies necessary to solve the exercises, readers will be prepared to successfully study even higher-level statistical theory.

"QlikView for Developers Cookbook" empowers you to elevate your QlikView development skills beyond the introductory level. Through practical recipes, this book provides hands-on exercises covering topics like advanced visualizations, data modeling challenges, and script writing. This is an ideal resource for developers looking to master QlikView's functionalities and apply advanced techniques. What this Book will help me do Master techniques for creating advanced visualizations in QlikView. Improve your applications by applying best practices in data modeling. Learn to script and automate tasks effectively within QlikView. Enhance performance optimization to deliver faster QlikView applications. Implement robust security measures for your QlikView solutions. Author(s) Stephen Redmond is a seasoned QlikView developer with over seven years of experience in designing and implementing business intelligence solutions. His expertise encompasses advanced scripting, data modeling, and visualization techniques, making him an authority on QlikView development. Stephen's hands-on approach in teaching helps practitioners achieve excellence in their use of QlikView. Who is it for? This book is tailored for individuals with a foundational knowledge of QlikView who want to advance their skills. Whether you're a developer at a QlikView customer, partner, or QlikView itself, or someone aiming to become an expert in QlikView development, this book is crafted for you. It assumes you have a basic understanding and are eager to solve complex problems and create advanced solutions.
Newcomers to quantitative analysis need practical guidance on how to analyze data in the real world yet most introductory books focus on lengthy derivations and justifications instead of practical techniques. Covering the technical and professional skills needed by analysts in the academic, private, and public sectors, Applying Analytics: A Practical Introduction systematically teaches novices how to apply algorithms to real data and how to recognize potential pitfalls. It offers one of the first textbooks for the emerging first course in analytics. The text concentrates on the interpretation, strengths, and weaknesses of analytical techniques, along with challenges encountered by analysts in their daily work. The author shares various lessons learned from applying analytics in the real world. He supplements the technical material with coverage of professional skills traditionally learned through experience, such as project management, analytic communication, and using analysis to inform decisions. Example data sets used in the text are available for download online so that readers can test their own analytic routines. Suitable for beginning analysts in the sciences, business, engineering, and government, this book provides an accessible, example-driven introduction to the emerging field of analytics. It shows how to interpret data and identify trends across a range of fields.
Practical Web Analytics for User Experience teaches you how to use web analytics to help answer the complicated questions facing UX professionals. Within this book, you'll find a quantitative approach for measuring a website's effectiveness and the methods for posing and answering specific questions about how users navigate a website. The book is organized according to the concerns UX practitioners face. Chapters are devoted to traffic, clickpath, and content use analysis, measuring the effectiveness of design changes, including A/B testing, building user profiles based on search habits, supporting usability test findings with reporting, and more. This is the must-have resource you need to start capitalizing on web analytics and analyze websites effectively. Discover concrete information on how web analytics data support user research and user-centered design Learn how to frame questions in a way that lets you navigate through massive amounts of data to get the answer you need Learn how to gather information for personas, verify behavior found in usability testing, support heuristic evaluation with data, analyze keyword data, and understand how to communicate these findings with business stakeholders
This book provides accessible treatment to state-of-the-art approaches to analyzing longitudinal studies. Comprehensive coverage of the most popular analysis tools allows readers to pick and choose the techniques that best fit their research. The analyses are illustrated with examples from major longitudinal data sets including practical information about their content and design. Illustrations from popular software packages offer tips on how to interpret the results. Each chapter features suggested readings for additional study and a list of articles that further illustrate how to implement the analysis and report the results. Syntax examples for several software packages for each of the chapter examples are provided at www.psypress.com/longitudinal-data-analysis. Although many of the examples address health or social science questions related to aging, readers from other disciplines will find the analyses relevant to their work. In addition to demonstrating statistical analysis of longitudinal data, the book shows how to interpret and analyze the results within the context of the research design. The methods covered in this book are applicable to a range of applied problems including short- to long-term longitudinal studies using a range of sample sizes. The book provides non-technical, practical introductions to the concepts and issues relevant to longitudinal analysis. Topics include use of publicly available data sets, weighting and adjusting for complex sampling designs with longitudinal studies, missing data and attrition, measurement issues related to longitudinal research, the use of ANOVA and regression for average change over time, mediation analysis, growth curve models, basic and advanced structural equation models, and survival analysis. An ideal supplement for graduate level courses on data analysis and/or longitudinal modeling taught in psychology, gerontology, public health, human development, family studies, medicine, sociology, social work, and other behavioral, social, and health sciences, this multidisciplinary book will also appeal to researchers in these fields.
Although many Bayesian Network (BN) applications are now in everyday use, BNs have not yet achieved mainstream penetration. Focusing on practical real-world problem solving and model building, as opposed to algorithms and theory, Risk Assessment and Decision Analysis with Bayesian Networks explains how to incorporate knowledge with data to develop and use (Bayesian) causal models of risk that provide powerful insights and better decision making. Provides all tools necessary to build and run realistic Bayesian network models Supplies extensive example models based on real risk assessment problems in a wide range of application domains provided; for example, finance, safety, systems reliability, law, and more Introduces all necessary mathematics, probability, and statistics as needed The book first establishes the basics of probability, risk, and building and using BN models, then goes into the detailed applications. The underlying BN algorithms appear in appendices rather than the main text since there is no need to understand them to build and use BN models. Keeping the body of the text free of intimidating mathematics, the book provides pragmatic advice about model building to ensure models are built efficiently. A dedicated website, www.BayesianRisk.com, contains executable versions of all of the models described, exercises and worked solutions for all chapters, PowerPoint slides, numerous other resources, and a free downloadable copy of the AgenaRisk software.
Statistical Concepts consists of the last 9 chapters of An Introduction to Statistical Concepts, 3rd ed. Designed for the second course in statistics, it is one of the few texts that focuses just on intermediate statistics. The book highlights how statistics work and what they mean to better prepare students to analyze their own data and interpret SPSS and research results. As such it offers more coverage of non-parametric procedures used when standard assumptions are violated since these methods are more frequently encountered when working with real data. Determining appropriate sample sizes is emphasized throughout. Only crucial equations are included. The new edition features: New co-author, Debbie L. Hahs-Vaughn, the 2007 recipient of the University of Central Florida's College of Education Excellence in Graduate Teaching Award. A new chapter on logistic regression models for today's more complex methodologies. Much more on computing confidence intervals and conducting power analyses using G*Power. All new SPSS version 19 screenshots to help navigate through the program and annotated output to assist in the interpretation of results. Sections on how to write-up statistical results in APA format and new templates for writing research questions. New learning tools including chapter-opening vignettes, outlines, a list of key concepts, "Stop and Think" boxes, and many more examples, tables, and figures. More tables of assumptions and the effects of their violation including how to test them in SPSS. 33% new conceptual, computational, and all new interpretative problems. A website with Power Points, answers to the even-numbered problems, detailed solutions to the odd-numbered problems, and test items for instructors, and for students the chapter outlines, key concepts, and datasets. Each chapter begins with an outline, a list of key concepts, and a research vignette related to the concepts. Realistic examples from education and the behavioral sciences illustrate those concepts. Each example examines the procedures and assumptions and provides tips for how to run SPSS and develop an APA style write-up. Tables of assumptions and the effects of their violation are included, along with how to test assumptions in SPSS. Each chapter includes computational, conceptual, and interpretive problems. Answers to the odd-numbered problems are provided. The SPSS data sets that correspond to the book’s examples and problems are available on the web. The book covers basic and advanced analysis of variance models and topics not dealt with in other texts such as robust methods, multiple comparison and non-parametric procedures, and multiple and logistic regression models. Intended for courses in intermediate statistics and/or statistics II taught in education and/or the behavioral sciences, predominantly at the master's or doctoral level. Knowledge of introductory statistics is assumed.
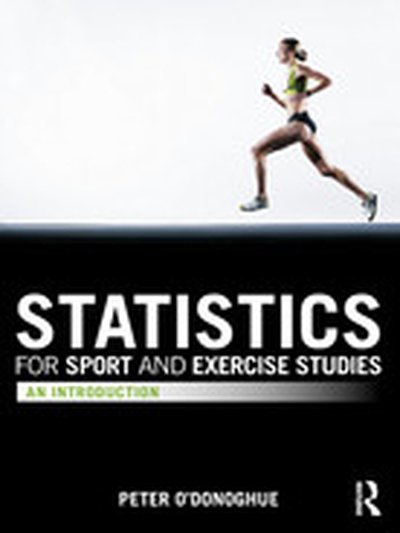
Statistics for Sport and Exercise Studies guides the student through the full research process, from selecting the most appropriate statistical procedure, to analysing data, to the presentation of results, illustrating every key step in the process with clear examples, case-studies and data taken from real sport and exercise settings. Every chapter includes a range of features designed to help the student grasp the underlying concepts and relate each statistical procedure to their own research project, including definitions of key terms, practical exercises, worked examples and clear summaries. The book also offers an in-depth and practical guide to using SPSS in sport and exercise research, the most commonly used data analysis software in sport and exercise departments. In addition, a companion website includes more than 100 downloadable data sets and work sheets for use in or out of the classroom, full solutions to exercises contained in the book, plus over 1,300 PowerPoint slides for use by tutors and lecturers. Statistics for Sport and Exercise Studies is a complete, user-friendly introduction to the use of statistical tests, techniques and procedures in sport, exercise and related subjects. Visit the companion website at: www.routledge.com/cw/odonoghue
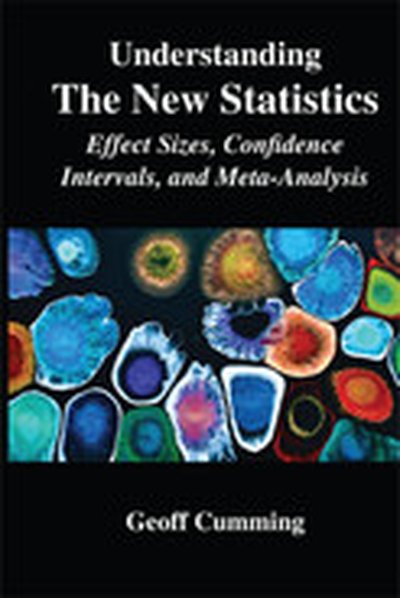
This is the first book to introduce the new statistics - effect sizes, confidence intervals, and meta-analysis - in an accessible way. It is chock full of practical examples and tips on how to analyze and report research results using these techniques. The book is invaluable to readers interested in meeting the new APA Publication Manual guidelines by adopting the new statistics - which are more informative than null hypothesis significance testing, and becoming widely used in many disciplines. Accompanying the book is the Exploratory Software for Confidence Intervals (ESCI) package, free software that runs under Excel and is accessible at www.thenewstatistics.com. The book’s exercises use ESCI's simulations, which are highly visual and interactive, to engage users and encourage exploration. Working with the simulations strengthens understanding of key statistical ideas. There are also many examples, and detailed guidance to show readers how to analyze their own data using the new statistics, and practical strategies for interpreting the results. A particular strength of the book is its explanation of meta-analysis, using simple diagrams and examples. Understanding meta-analysis is increasingly important, even at undergraduate levels, because medicine, psychology and many other disciplines now use meta-analysis to assemble the evidence needed for evidence-based practice. The book’s pedagogical program, built on cognitive science principles, reinforces learning: Boxes provide "evidence-based" advice on the most effective statistical techniques. Numerous examples reinforce learning, and show that many disciplines are using the new statistics. Graphs are tied in with ESCI to make important concepts vividly clear and memorable. Opening overviews and end of chapter take-home messages summarize key points. Exercises encourage exploration, deep understanding, and practical applications. This highly accessible book is intended as the core text for any course that emphasizes the new statistics, or as a supplementary text for graduate and/or advanced undergraduate courses in statistics and research methods in departments of psychology, education, human development , nursing, and natural, social, and life sciences. Researchers and practitioners interested in understanding the new statistics, and future published research, will also appreciate this book. A basic familiarity with introductory statistics is assumed.
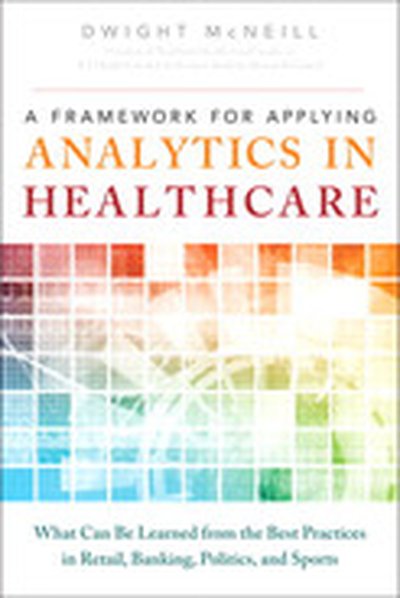
In A Framework for Applying Analytics in Healthcare, Dwight McNeill shows healthcare analysts and decision-makers exactly how to adapt and apply the best analytics techniques from retail, finance, politics, and sports. McNeill describes each method in depth, presenting numerous case studies that show how these approaches have been deployed and the results that have been achieved. Most important, he explains how these methods can be successfully adapted to the most critical challenges you now face in your healthcare organization. From predictive modeling to social media, this book focuses on innovative techniques with demonstrated effectiveness and direct relevance to healthcare. You’ll discover powerful new ways to manage population health; improve patient activation, support, and experience of care; focus on health outcomes; measure what matters for team performance; make information more actionable; and build more customer-centric organizations.
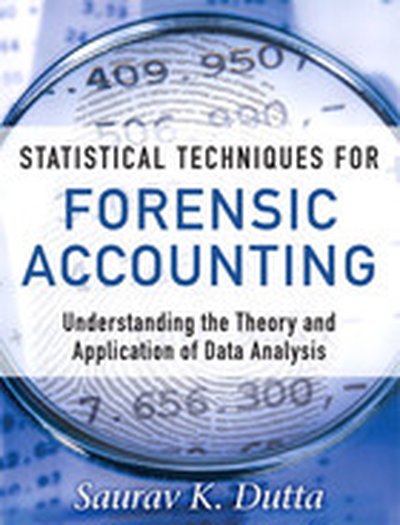
Master powerful statistical techniques for uncovering fraud or misrepresentation in complex financial data. The discipline of statistics has developed sophisticated, well-accepted approaches for identifying financial fraud and demonstrating that it is deliberate. Statistical Techniques for Forensic Accounting is the first comprehensive guide to these tools and techniques. Leading expert Dr. Saurav Dutta explains their mathematical underpinnings, shows how to use them properly, and guides you in communicating your findings to other interested and knowledgeable parties, or assessing others' analyses. Dutta is singularly well-qualified to write this book: he has been engaged as an expert in many of the world's highest-profile financial fraud cases, including Worldcom, Global Crossing, Cendant, and HealthSouth. Here, he covers everything professionals need to know to construct and conduct valid and defensible statistical tests, perform analyses, and interpret others' analyses. Coverage includes: exploratory data analysis to identify the "Fraud Triangle" and other red flags… data mining tools, usage, and limitations… statistical terms and methods applicable to forensic accounting… relevant uncertainty and probability concepts… Bayesian analysis and networks… statistical inference, sampling, sample size, estimation, regression, correlation, classification, prediction, and much more. For all forensic accountants, auditors, investigators, and litigators involved with corporate financial reporting; and for all students interested in forensic accounting and related fields.

Data mining has witnessed substantial advances in recent decades. New research questions and practical challenges have arisen from emerging areas and applications within the various fields closely related to human daily life, e.g. social media and social networking. This book aims to bridge the gap between traditional data mining and the latest advances in newly emerging information services. It explores the extension of well-studied algorithms and approaches into these new research arenas.
This classic text on multiple regression is noted for its nonmathematical, applied, and data-analytic approach. Readers profit from its verbal-conceptual exposition and frequent use of examples. The applied emphasis provides clear illustrations of the principles and provides worked examples of the types of applications that are possible. Researchers learn how to specify regression models that directly address their research questions. An overview of the fundamental ideas of multiple regression and a review of bivariate correlation and regression and other elementary statistical concepts provide a strong foundation for understanding the rest of the text. The third edition features an increased emphasis on graphics and the use of confidence intervals and effect size measures, and an accompanying website with data for most of the numerical examples along with the computer code for SPSS, SAS, and SYSTAT, at www.psypress.com/9780805822236 . Applied Multiple Regression serves as both a textbook for graduate students and as a reference tool for researchers in psychology, education, health sciences, communications, business, sociology, political science, anthropology, and economics. An introductory knowledge of statistics is required. Self-standing chapters minimize the need for researchers to refer to previous chapters.
Fudenberg and Tirole use the game-theoretic issues of information, commitment and timing to provide a realistic approach to oligopoly.
' Measuring the sustainability of development is crucial to achieving it, and is one of the most actively studied issues in the area. To date, most studies of measurements or indicators have been largely theoretical.
However, this book, a follow-on to Bell and Morse's highly influential Sustainability Indicators (1999), presents valuable practical advice on how to develop measurements that will work in real-life development contexts. It describes and analyses how to derive, validate and apply indicators in the course of an actual development project - in this case the Mediterranean Action Plan in Malta.
The authors explain the trade-offs and constraints involved and how it is possible to combine the open-ended and flexible perspectives of sustainability with the more linear processes and fixed targets of specific projects through the use of pragmatic and reflective methodologies.
Despite the excitement around "data science," "big data," and "analytics," the ambiguity of these terms has led to poor communication between data scientists and organizations seeking their help. In this report, authors Harlan Harris, Sean Murphy, and Marck Vaisman examine their survey of several hundred data science practitioners in mid-2012, when they asked respondents how they viewed their skills, careers, and experiences with prospective employers. The results are striking. Based on the survey data, the authors found that data scientists today can be clustered into four subgroups, each with a different mix of skillsets. Their purpose is to identify a new, more precise vocabulary for data science roles, teams, and career paths. This report describes: Four data scientist clusters: Data Businesspeople, Data Creatives, Data Developers, and Data Researchers Cases in miscommunication between data scientists and organizations looking to hire Why "T-shaped" data scientists have an advantage in breadth and depth of skills How organizations can apply the survey results to identify, train, integrate, team up, and promote data scientists
Based on forty years of experience and research, this book provides guidance on forecasting for strategic decision making. It includes methodology, tools, and models. It also explains how to apply sanity checks to existing forecasts to rank project valuations, identify project risks, and select the higher value creation projects. The author discusses how to assess the feasibility of large projects, analyze forecasting models to determine controllable levers, and create the conditions needed for forecasts to materialize.
Designed to benefit scientific and engineering applications, Numerical Methods for Engineers and Scientists Using MATLAB® focuses on the fundamentals of numerical methods while making use of MATLAB software. The book introduces MATLAB early on and incorporates it throughout the chapters to perform symbolic, graphical, and numerical tasks. The text covers a variety of methods from curve fitting to solving ordinary and partial differential equations. Provides fully worked-out examples showing all details Confirms results through the execution of the user-defined function or the script file Executes built-in functions for re-confirmation, when available Generates plots regularly to shed light on the soundness and significance of the numerical results Created to be user-friendly and easily understandable, Numerical Methods for Engineers and Scientists Using MATLAB® provides background material and a broad introduction to the essentials of MATLAB, specifically its use with numerical methods. Building on this foundation, it introduces techniques for solving equations and focuses on curve fitting and interpolation techniques. It addresses numerical differentiation and integration methods, presents numerical methods for solving initial-value and boundary-value problems, and discusses the matrix eigenvalue problem, which entails numerical methods to approximate a few or all eigenvalues of a matrix. The book then deals with the numerical solution of partial differential equations, specifically those that frequently arise in engineering and science. The book presents a user-defined function or a MATLAB script file for each method, followed by at least one fully worked-out example. When available, MATLAB built-in functions are executed for confirmation of the results. A large set of exercises of varying levels of difficulty appears at the end of each chapter. The concise approach with strong, up-to-date MATLAB integration provided by this book affords readers a thorough knowledge of the fundamentals of numerical methods utilized in various disciplines.
Explore the practices and cutting-edge research on the new and exciting topic of paradata Paradata are measurements related to the process of collecting survey data. Improving Surveys with Paradata: Analytic Uses of Process Information is the most accessible and comprehensive contribution to this up-and-coming area in survey methodology. Featuring contributions from leading experts in the field, Improving Surveys with Paradata: Analytic Uses of Process Information introduces and reviews issues involved in the collection and analysis of paradata. The book presents readers with an overview of the indispensable techniques and new, innovative research on improving survey quality and total survey error. Along with several case studies, topics include: Using paradata to monitor fieldwork activity in face-to-face, telephone, and web surveys Guiding intervention decisions during data collection Analysis of measurement, nonresponse, and coverage error via paradata Providing a practical, encompassing guide to the subject of paradata, the book is aimed at both producers and users of survey data. Improving Surveys with Paradata: Analytic Uses of Process The book also serves as an excellent resource for courses on data collection, survey methodology, and nonresponse and measurement error.
In digital marketing, your goal is to funnel your potential customers from the point of making them aware of your website, through engagement and conversion, and ultimately retaining them as loyal customers. Your strategies must be based on careful analysis so you know what is working for you at each stage. Adobe Analytics with SiteCatalyst Classroom in a Book teaches effective techniques for using Adobe SiteCatalyst to establish and measure key performance indicators (KPIs) tailored to your business and website. For each phase of marketing funnel analytics, author Vidya Subramanian walks you through multiple reports, showing you how to interpret the data and highlighting implementation details that affect data quality. With this essential guide, you’ll learn to optimize your web analytics results with SiteCatalyst. Adobe Analytics with SiteCatalyst Classroom in a Book contains 10 lessons. The book covers the basics of learning Adobe SiteCatalyst and provides countless tips and techniques to help you become more productive with the program. You can follow the book from start to finish or choose only those lessons that interest you. Classroom in a Book®, the best-selling series of hands-on software training workbooks, helps you learn the features of Adobe software quickly and easily. Classroom in a Book offers what no other book or training program does—an official training series from Adobe Systems Incorporated, developed with the support of Adobe product experts. ..
"IBM Cognos 10 Framework Manager" is your complete guide to mastering the key features of IBM Cognos Framework Manager for robust data modeling. By following practical, step-by-step lessons enhanced with expert tips, you'll progress from handling imported data to developing dynamic, user-friendly data models optimized for Business Intelligence reporting. What this Book will help me do Import and model relational data effectively to support diverse reporting needs. Create organized, well-structured reporting packages for easy data access and usage. Utilize parameters and parameter reports to enable dynamic and adaptable reporting solutions. Manage models in multi-user environments, fostering collaboration and enhanced functionality. Leverage the Model Design Accelerator to quickly develop well-designed initial data models. Author(s) Terence Phillip Curran has extensive experience in data modeling and IBM Cognos technology. Through his practical expertise and hands-on teaching methods, he has become a trusted source of guidance in the field. In this book, Curran combines his practical knowledge with clear explanations to help users fully utilize IBM Cognos Framework Manager. Who is it for? This book serves developers interested in using IBM Cognos Framework Manager to build and optimize data models. If you're new to the tool, you'll benefit from its thorough and accessible approach to learning. For experienced users, it offers advanced techniques and tips to improve and streamline your modeling efforts. Whether you're preparing reporting packages or building multi-user collaborative models, this book provides the practical guidance you need.
Why Everyone Needs Analytical Skills Welcome to the age of data. No matter your interests (sports, movies, politics), your industry (finance, marketing, technology, manufacturing), or the type of organization you work for (big company, nonprofit, small start-up)—your world is awash with data. As a successful manager today, you must be able to make sense of all this information. You need to be conversant with analytical terminology and methods and able to work with quantitative information. This book promises to become your “quantitative literacy" guide—helping you develop the analytical skills you need right now in order to summarize data, find the meaning in it, and extract its value. In Keeping Up with the Quants, authors, professors, and analytics experts Thomas Davenport and Jinho Kim offer practical tools to improve your understanding of data analytics and enhance your thinking and decision making. You’ll gain crucial skills, including: How to formulate a hypothesis How to gather and analyze relevant data How to interpret and communicate analytical results How to develop habits of quantitative thinking How to deal effectively with the “quants” in your organizationBig data and the analytics based on it promise to change virtually every industry and business function over the next decade. If you don’t have a business degree or if you aren’t comfortable with statistics and quantitative methods, this book is for you. Keeping Up with the Quants will give you the skills you need to master this new challenge—and gain a significant competitive edge.