In this episode, Benjamin Uminsky enlightens us about some of the ways the Los Angeles County Registrar-Recorder/County Clerk leverages data science and analysis to help be more effective and efficient with the services and expectations they provide citizens. Our topics range from forecasting to predicting the likelihood that people will volunteer to be poll workers. Benjamin recently spoke at Big Data Day LA. Videos have not yet been posted, but you can see the slides from his talk Data Mining Forecasting and BI at the RRCC if this episode has left you hungry to learn more. During the show, Benjamin encouraged any Los Angeles residents who have some time to serve their community consider becoming a pollworker.
 talk-data.com
Topic
BI
Business Intelligence (BI)
data_visualization
reporting
analytics
1211
tagged
Activity Trend
111
peak/qtr
2020-Q1
2026-Q2
Top Events
O'Reilly Data Science Books
224
O'Reilly Data Engineering Books
179
Data Engineering Podcast
142
O'Reilly Business Intelligence Books
84
Data + AI Summit 2025
78
Analytics on Fire
53
Secrets of Data Analytics Leaders
36
Databricks DATA + AI Summit 2023
34
Outlier Conference 2025
26
DataFramed
25
O'Reilly Data Visualization Books
21
SaaS Scaled - Interviews about SaaS Startups, Analytics, & Operations
21
"Learning SAP Business Objects Dashboards" is your definitive guide to mastering the creation of professional, interactive dashboards tailored for both desktop and mobile use. Whether you are starting with basics or looking to enhance your existing BI skill set, this book offers step-by-step guidance to build customizing and visually appealing dashboards using SAP Business Objects. What this Book will help me do Gain proficiency in using SAP BO Dashboard Designer to create compelling BI dashboards. Learn how to integrate data seamlessly into SAP dashboards for dynamic insights. Master the art of building interactive and responsive dashboards suitable for various devices. Explore advanced visualization techniques including maps, selectors, and styling. Understand how to ensure data security and successfully deploy your dashboards. Author(s) Taha Mahmoud is an experienced Business Intelligence consultant specializing in SAP technologies. With years of experience in crafting custom BI solutions, Taha brings a practical and approachable teaching style to the complex realm of dashboard design. His goal in writing this book is to impart practical skills to learners so they can confidently excel in their BI careers. Who is it for? This book is ideal for business analysts, BI developers, and data visualization enthusiasts aiming to learn or improve their SAP Business Objects dashboard skills. It requires basic knowledge of MS Excel and an analytical mindset. If you're tasked with presenting data in clear, impactful visuals or making interactive dashboards for your organization, this book is for you.
The industry’s most complete, useful, and up-to-date guide to SQL Server 2014. You’ll find start-to-finish coverage of SQL Server’s core database server and management capabilities: all the real-world information, tips, guidelines, and examples you’ll need to install, monitor, maintain, and optimize the most complex database environments. The provided examples and sample code provide plenty of hands-on opportunities to learn more about SQL Server and create your own viable solutions. Four leading SQL Server experts present deep practical insights for administering SQL Server, analyzing and optimizing queries, implementing data warehouses, ensuring high availability, tuning performance, and much more. You will benefit from their behind-the-scenes look into SQL Server, showing what goes on behind the various wizards and GUI-based tools. You’ll learn how to use the underlying SQL commands to fully unlock the power and capabilities of SQL Server. Writing for all intermediate-to-advanced-level SQL Server professionals, the authors draw on immense production experience with SQL Server. Throughout, they focus on successfully applying SQL Server 2014’s most powerful capabilities and its newest tools and features. Detailed information on how to… Understand SQL Server 2014’s new features and each edition’s capabilities and licensing Install, upgrade to, and configure SQL Server 2014 for better performance and easier management Streamline and automate key administration tasks with Smart Admin Leverage powerful new backup/restore options: flexible backup to URL, Managed Backup to Windows Azure, and encrypted backups Strengthen security with new features for enforcing “least privilege” Improve performance with updateable columnstore indexes, Delayed Durability, and other enhancements Execute queries and business logic more efficiently with memoryoptimized tables, buffer pool extension, and natively-compiled stored procedures Control workloads and Disk I/O with the Resource Governor Deploy AlwaysOn Availability Groups and Failover Cluster Instances to achieve enterprise-class availability and disaster recovery Apply new Business Intelligence improvements in Master Data Services, data quality, and Parallel Data Warehouse
Leverage the integration of SQL Server and Office for more effective BI Applied Microsoft Business Intelligence shows you how to leverage the complete set of Microsoft tools—including Microsoft Office and SQL Server—to better analyze business data. This book provides best practices for building complete BI solutions using the full Microsoft toolset. You will learn how to effectively use SQL Server Analysis and Reporting Services, along with Excel, SharePoint, and other tools to provide effective and cohesive solutions for the enterprise. Coverage includes BI architecture, data queries, semantic models, multidimensional modeling, data analysis and visualization, performance monitoring, data mining, and more, to help you learn to perform practical business analysis and reporting. Written by an author team that includes a key member of the BI product team at Microsoft, this useful reference provides expert instruction for more effective use of the Microsoft BI toolset. Use Microsoft BI suite cohesively for more effective enterprise solutions Search, analyze, and visualize data more efficiently and completely Develop flexible and scalable tabular and multidimensional models Monitor performance, build a BI portal, and deploy and manage the BI Solution
Business Intelligence with SQL Server Reporting Services helps you deliver business intelligence with panache. Harness the power of the Reporting Services toolkit to combine charts, gauges, sparklines, indicators, and maps into compelling dashboards and scorecards. Create compelling visualizations that seize your audience’s attention and help business users identify and react swiftly to changing business conditions. Best of all, you'll do all these things by creating new value from software that is already installed and paid for – SQL Server and the included SQL Server Reporting Services. Businesses run on numbers, and good business intelligence systems make the critical numbers immediately and conveniently accessible. Business users want access to key performance indicators in the office, at the beach, and while riding the subway home after a day's work. Business Intelligence with SQL Server Reporting Services helps you meet these need for anywhere/anytime access by including chapters specifically showing how to deliver on modern devices such as smart phones and tablets. You'll learn to deliver the same information, with similar look-and-feel, across the entire range of devices used in business today. Key performance indicators give fast notification of business unit performance Polished dashboards deliver essential metrics and strategic comparisons Visually arresting output on multiple devices focuses attention
T-SQL insiders help you tackle your toughest queries and query-tuning problems Squeeze maximum performance and efficiency from every T-SQL query you write or tune. Four leading experts take an in-depth look at T-SQL’s internal architecture and offer advanced practical techniques for optimizing response time and resource usage. Emphasizing a correct understanding of the language and its foundations, the authors present unique solutions they have spent years developing and refining. All code and techniques are fully updated to reflect new T-SQL enhancements in Microsoft SQL Server 2014 and SQL Server 2012. Write faster, more efficient T-SQL code: Move from procedural programming to the language of sets and logic Master an efficient top-down tuning methodology Assess algorithmic complexity to predict performance Compare data aggregation techniques, including new grouping sets Efficiently perform data-analysis calculations Make the most of T-SQL’s optimized bulk import tools Avoid date/time pitfalls that lead to buggy, poorly performing code Create optimized BI statistical queries without additional software Use programmable objects to accelerate queries Unlock major performance improvements with In-Memory OLTP Master useful and elegant approaches to manipulating graphs About This Book For experienced T-SQL practitioners Includes coverage updated from and Inside Microsoft SQL Server 2008 T-SQL Querying Inside Microsoft SQL Server 2008 T-SQL Programming Valuable to developers, DBAs, BI professionals, and data scientists Covers many MCSE 70-464 and MCSA/MCSE 70-461 exam topics
The only Oracle Press guide to creating effective visual presentations of business intelligence data quickly and easily Data Visualization for Oracle Business Intelligence 11g reveals the best practices for creating graphs, tables, maps, and other methodologies for presenting data-driven insights using one of the most common business intelligence front-end systems in the world, Oracle Business Intelligence 11 g. This information-rich guide offers clear instructions for building top-quality dashboards, analyses, and visualizations from real-world implementers and respected data visualization experts. You’ll learn everything from improving the readability of your tables to implementing the latest Advanced Trellis Chart features and from adding native map views of BI data to designing optimal dashboard layout strategies. You’ll see how to produce accurate, compelling, and professional graphics that will immediately enhance corporate decision making. Shows proven steps for extracting maximum impact from native features that are little known to the majority of BI users Covers dashboard strategy, including layout, design, navigation, master detail linking, action links, and prompts Addresses how to extend Oracle Business Intelligence 11 g with advanced languages and visualization systems such as JavaScript-based D3 and JQuery, R, and Oracle Application Development Framework Includes an associated web gallery showcasing the colors and graphics that render best digitally
In all the excitement around Big Data and Analytics, even savvy users of business intelligence can get a bit confused about how and when to use A/B Testing, Predictive Analytics, and Personalization to optimize. But optimizing isn’t about choosing which tool to use: Optimizing is about making decisions. The digital environment gives us an opportunity to make these marketing decisions at scale. In this session we’ll discuss how to bring these tools together to make better decisions, we’ll also touch on how machine learning can help us automate the process to free up analytics teams to focus on the higher value problems.
Beginning SQL Server for Developers is the perfect book for developers new to SQL Server and planning to create and deploy applications against Microsoft’s market-leading database system for the Windows platform. Now in its fourth edition, the book is enhanced to cover the very latest developments in SQL Server, including the in-memory features that are introduced in SQL Server 2014. Within the book, there are plenty of examples of tasks that developers routinely perform. You’ll learn to create tables and indexes, and be introduced to best practices for securing your valuable data. You’ll learn design tradeoffs and find out how to make sound decisions resulting in scalable databases and maintainable code. SQL Server 2014 introduces in-memory tables and stored procedures. It's now possible to accelerate applications by creating tables (and their indexes) that reside entirely in memory, and never on disk. These new, in-memory structures differ from caching mechanisms of the past, and make possible the extraordinarily swift execution of certain types of queries such as are used in business intelligence applications. Beginning SQL Server for Developers helps you realize the promises of this new feature set while avoiding pitfalls that can occur when mixing in-memory tables and code with traditional, disk-based tables and code. Beginning SQL Server for Developers takes you through the entire database development process, from installing the software to creating a database to writing the code to connect to that database and move data in and out. By the end of the book, you’ll be able to design and create solid and reliable database solutions using SQL Server. Takes you through the entire database application development lifecycle Includes brand new coverage of the in-memory features Introduces the freely-available Express Edition
“This book is a splendid and valuable addition to this subject. The whole book is well written and I have no hesitation to recommend that this can be adapted as a textbook for graduate courses in Business Intelligence and Data Mining.” Dr. Edi Shivaji, Des Moines, Iowa “As a complete novice to this area just starting out on a MBA course I found the book incredibly useful and very easy to follow and understand. The concepts are clearly explained and make it an easy task to gain an understanding of the subject matter.” -- Mr. Craig Domoney, South Africa. Business Intelligence and Data Mining is a conversational and informative book in the exploding area of Business Analytics. Using this book, one can easily gain the intuition about the area, along with a solid toolset of major data mining techniques and platforms. This book can thus be gainfully used as a textbook for a college course. It is also short and accessible enough for a busy executive to become a quasi-expert in this area in a couple of hours. Every chapter begins with a case-let from the real world, and ends with a case study that runs across the chapters.
SQL Server Integration Services Design Patterns is newly-revised for SQL Server 2014, and is a book of recipes for SQL Server Integration Services (SSIS). Design patterns in the book help to solve common problems encountered when developing data integration solutions. The patterns and solution examples in the book increase your efficiency as an SSIS developer, because you do not have to design and code from scratch with each new problem you face. The book's team of expert authors take you through numerous design patterns that you'll soon be using every day, providing the thought process and technical details needed to support their solutions. SQL Server Integration Services Design Patterns goes beyond the surface of the immediate problems to be solved, delving into why particular problems should be solved in certain ways. You'll learn more about SSIS as a result, and you'll learn by practical example. Where appropriate, the book provides examples of alternative patterns and discusses when and where they should be used. Highlights of the book include sections on ETL Instrumentation, SSIS Frameworks, Business Intelligence Markup Language, and Dependency Services. Takes you through solutions to common data integration challenges Provides examples involving Business Intelligence Markup Language Teaches SSIS using practical examples
Put Predictive Analytics into ActionLearn the basics of Predictive Analysis and Data Mining through an easy to understand conceptual framework and immediately practice the concepts learned using the open source RapidMiner tool. Whether you are brand new to Data Mining or working on your tenth project, this book will show you how to analyze data, uncover hidden patterns and relationships to aid important decisions and predictions. Data Mining has become an essential tool for any enterprise that collects, stores and processes data as part of its operations. This book is ideal for business users, data analysts, business analysts, business intelligence and data warehousing professionals and for anyone who wants to learn Data Mining.You’ll be able to:1. Gain the necessary knowledge of different data mining techniques, so that you can select the right technique for a given data problem and create a general purpose analytics process.2. Get up and running fast with more than two dozen commonly used powerful algorithms for predictive analytics using practical use cases.3. Implement a simple step-by-step process for predicting an outcome or discovering hidden relationships from the data using RapidMiner, an open source GUI based data mining tool Predictive analytics and Data Mining techniques covered: Exploratory Data Analysis, Visualization, Decision trees, Rule induction, k-Nearest Neighbors, Naïve Bayesian, Artificial Neural Networks, Support Vector machines, Ensemble models, Bagging, Boosting, Random Forests, Linear regression, Logistic regression, Association analysis using Apriori and FP Growth, K-Means clustering, Density based clustering, Self Organizing Maps, Text Mining, Time series forecasting, Anomaly detection and Feature selection. Implementation files can be downloaded from the book companion site at www.LearnPredictiveAnalytics.com Demystifies data mining concepts with easy to understand language Shows how to get up and running fast with 20 commonly used powerful techniques for predictive analysis Explains the process of using open source RapidMiner tools Discusses a simple 5 step process for implementing algorithms that can be used for performing predictive analytics Includes practical use cases and examples
"Mastering QlikView" is your advanced guide to unlocking the potential of business intelligence through QlikView. Dive deep into powerful data modeling, performance tuning, and visualization techniques, crafted to empower you in making data-driven decisions and optimizing your BI workflows. What this Book will help me do Understand and implement advanced QlikView data modeling techniques for efficient analysis. Master performance tuning methods to ensure your QlikView applications are fast and scalable. Apply industry best practices for ETL and data loading using QVDs and other QlikView features. Create advanced visualizations and dashboards that distill analytics into actionable insights. Leverage metadata management tools and governance techniques to maintain data integrity and consistency. Author(s) Stephen Redmond, an expert in business intelligence and data visualization, brings years of hands-on experience with QlikView and Qlik Sense. As a seasoned developer and thought leader, Stephen specializes in distilling complex BI methodologies into practical skills. His approachable style makes advanced topics accessible and engaging to readers. Who is it for? This book is tailored for business application developers and system analysts already familiar with QlikView. Ideal for professionals seeking to enhance their BI proficiency with advanced QlikView capabilities. If you're aiming to solve complex data challenges or refine your visualization skills, this book provides the expert guidance to take your knowledge further.
Corporations and governmental agencies of all sizes are embracing a new generation of enterprise-scale business intelligence (BI) and data warehousing (DW), and very often appoint a single senior-level individual to serve as the Enterprise BI/DW Program Manager. This book is the essential guide to the incremental and iterative build-out of a successful enterprise-scale BI/DW program comprised of multiple underlying projects, and what the Enterprise Program Manager must successfully accomplish to orchestrate the many moving parts in the quest for true enterprise-scale business intelligence and data warehousing. Author Alan Simon has served as an enterprise business intelligence and data warehousing program management advisor to many of his clients, and spent an entire year with a single client as the adjunct consulting director for a $10 million enterprise data warehousing (EDW) initiative. He brings a wealth of knowledge about best practices, risk management, organizational culture alignment, and other Critical Success Factors (CSFs) to the discipline of enterprise-scale business intelligence and data warehousing.
by
Khirallah Birkler
,
Navneet Goyal
,
Peter Bahrs
,
Jorg Stolzenberg
,
Nick Norris
,
Michel Laaroussi
,
Michael Love
,
Bernd Eberhardt
,
Andrew Stalnecker
,
Derek Jennings
,
Stefan Momma
,
Manfred Oevers
,
Yaro Dunchych
,
Joe Kaczmarek
,
Martin Oberhofer
,
James Hunter
,
Paul Pacholski
,
Pierre Valiquette
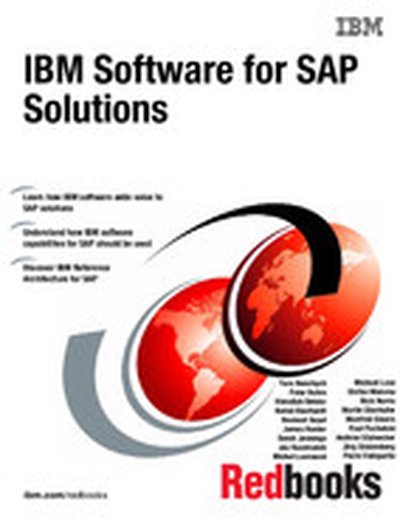
SAP is a market leader in enterprise business application software. SAP solutions provide a rich set of composable application modules, and configurable functional capabilities that are expected from a comprehensive enterprise business application software suite. In most cases, companies that adopt SAP software remain heterogeneous enterprises running both SAP and non-SAP systems to support their business processes. Regardless of the specific scenario, in heterogeneous enterprises most SAP implementations must be integrated with a variety of non-SAP enterprise systems: Portals Messaging infrastructure Business process management (BPM) tools Enterprise Content Management (ECM) methods and tools Business analytics (BA) and business intelligence (BI) technologies Security Systems of record Systems of engagement When SAP software is used in a large, heterogeneous enterprise environment, SAP clients face the dilemma of selecting the correct set of tools and platforms to implement SAP functionality, and to integrate the SAP solutions with non-SAP systems. This IBM® Redbooks® publication explains the value of integrating IBM software with SAP solutions. It describes how to enhance and extend pre-built capabilities in SAP software with best-in-class IBM enterprise software, enabling clients to maximize return on investment (ROI) in their SAP investment and achieve a balanced enterprise architecture approach. This book describes IBM Reference Architecture for SAP, a prescriptive blueprint for using IBM software in SAP solutions. The reference architecture is focused on defining the use of IBM software with SAP, and is not intended to address the internal aspects of SAP components. The chapters of this book provide a specific reference architecture for many of the architectural domains that are each important for a large enterprise to establish common strategy, efficiency, and balance. The majority of the most important architectural domain topics, such as integration, process optimization, master data management, mobile access, Enterprise Content Management, business intelligence, DevOps, security, systems monitoring, and so on, are covered in the book. However, there are several other architectural domains which are not included in the book. This is not to imply that these other architectural domains are not important or are less important, or that IBM does not offer a solution to address them. It is only reflective of time constraints, available resources, and the complexity of assembling a book on an extremely broad topic. Although more content could have been added, the authors feel confident that the scope of architectural material that has been included should provide organizations with a fantastic head start in defining their own enterprise reference architecture for many of the important architectural domains, and it is hoped that this book provides great value to those reading it. This IBM Redbooks publication is targeted to the following audiences: Client decision makers and solution architects leading enterprise transformation projects and wanting to gain further insight so that they can benefit from the integration of IBM software in large-scale SAP projects. IT architects and consultants integrating IBM technology with SAP solutions.
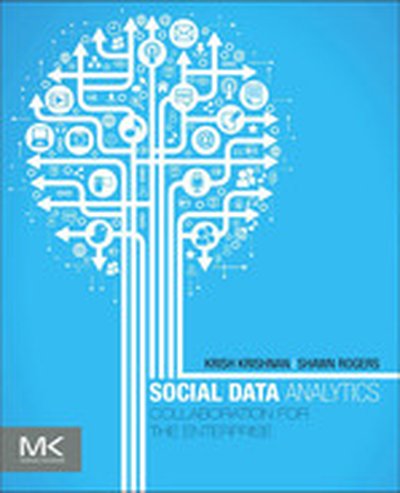
Social Data Analytics is the first practical guide for professionals who want to employ social data for analytics and business intelligence (BI). This book provides a comprehensive overview of the technologies and platforms and shows you how to access and analyze the data. You'll explore the five major types of social data and learn from cases and platform examples to help you make the most of sentiment, behavioral, social graph, location, and rich media data. A four-step approach to the social BI process will help you access, evaluate, collaborate, and share social data with ease. You'll learn everything you need to know to monitor social media and get an overview of the leading vendors in a crowded space of BI applications. By the end of this book, you will be well prepared for your organization’s next social data analytics project. Provides foundational understanding of new and emerging technologies—social data, collaboration, big data, advanced analytics Includes case studies and practical examples of success and failures Will prepare you to lead projects and advance initiatives that will benefit you and your organization
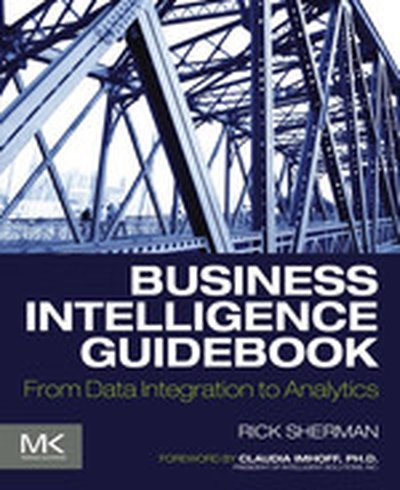
Between the high-level concepts of business intelligence and the nitty-gritty instructions for using vendors’ tools lies the essential, yet poorly-understood layer of architecture, design and process. Without this knowledge, Big Data is belittled – projects flounder, are late and go over budget. Business Intelligence Guidebook: From Data Integration to Analytics shines a bright light on an often neglected topic, arming you with the knowledge you need to design rock-solid business intelligence and data integration processes. Practicing consultant and adjunct BI professor Rick Sherman takes the guesswork out of creating systems that are cost-effective, reusable and essential for transforming raw data into valuable information for business decision-makers. After reading this book, you will be able to design the overall architecture for functioning business intelligence systems with the supporting data warehousing and data-integration applications. You will have the information you need to get a project launched, developed, managed and delivered on time and on budget – turning the deluge of data into actionable information that fuels business knowledge. Finally, you’ll give your career a boost by demonstrating an essential knowledge that puts corporate BI projects on a fast-track to success. Provides practical guidelines for building successful BI, DW and data integration solutions. Explains underlying BI, DW and data integration design, architecture and processes in clear, accessible language. Includes the complete project development lifecycle that can be applied at large enterprises as well as at small to medium-sized businesses Describes best practices and pragmatic approaches so readers can put them into action. Companion website includes templates and examples, further discussion of key topics, instructor materials, and references to trusted industry sources.
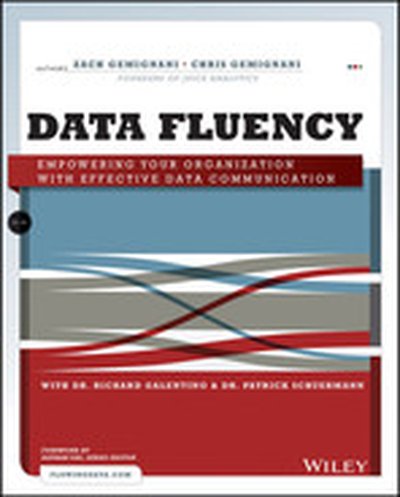
A dream come true for those looking to improve their data fluency Analytical data is a powerful tool for growing companies, but what good is it if it hides in the shadows? Bring your data to the forefront with effective visualization and communication approaches, and let Data Fluency: Empowering Your Organization with Effective Communication show you the best tools and strategies for getting the job done right. Learn the best practices of data presentation and the ways that reporting and dashboards can help organizations effectively gauge performance, identify areas for improvement, and communicate results. Topics covered in the book include data reporting and communication, audience and user needs, data presentation tools, layout and styling, and common design failures. Those responsible for analytics, reporting, or BI implementation will find a refreshing take on data and visualization in this resource, as will report, data visualization, and dashboard designers. Conquer the challenge of making valuable data approachable and easy to understand Develop unique skills required to shape data to the needs of different audiences Full color book links to bonus content at juiceanalytics.com Written by well-known and highly esteemed authors in the data presentation community Data Fluency: Empowering Your Organization with Effective Communication focuses on user experience, making reports approachable, and presenting data in a compelling, inspiring way. The book helps to dissolve the disconnect between your data and those who might use it and can help make an impact on the people who are most affected by data. Use Data Fluency today to develop the skills necessary to turn data into effective displays for decision-making.
Healthcare is changing, and data is the catalyst Data is taking over in a powerful way, and it's revolutionizing the healthcare industry. You have more data available than ever before, and applying the right analytics can spur growth. Benefits extend to patients, providers, and board members, and the technology can make centralized patient management a reality. Despite the potential for growth, many in the industry and government are questioning the value of data in health care, wondering if it's worth the investment. Data-Driven Healthcare: How Analytics and BI are Transforming the Industry tackles the issue and proves why BI is not only worth it, but necessary for industry advancement. Healthcare BI guru Laura Madsen challenges the notion that data have little value in healthcare, and shows how BI can ease regulatory reporting pressures and streamline the entire system as it evolves. Madsen illustrates how a data-driven organization is created, and how it can transform the industry. Learn why BI is a boon to providers Create powerful infographics to communicate data more effectively Find out how Big Data has transformed other industries, and how it applies to healthcare Data-Driven Healthcare: How Analytics and BI are Transforming the Industry provides tables, checklists, and forms that allow you to take immediate action in implementing BI in your organization. You can't afford to be behind the curve. The industry is moving on, with or without you. Data-Driven Healthcare: How Analytics and BI are Transforming the Industry is your guide to utilizing data to advance your operation in an industry where data-fueled growth will be the new norm.
This tutorial for data analysts new to SAS Enterprise Guide and SAS Enterprise Miner provides valuable experience using powerful statistical software to complete the kinds of business analytics common to most industries.
Today’s businesses increasingly use data to drive decisions that keep them competitive. Especially with the influx of big data, the importance of data analysis to improve every dimension of business cannot be overstated. Data analysts are therefore in demand; however, many hires and prospective hires, although talented with respect to business and statistics, lack the know-how to perform business analytics with advanced statistical software.
Business Analytics Using SAS Enterprise Guide and SAS Enterprise Miner is a beginner’s guide with clear, illustrated, step-by-step instructions that will lead you through examples based on business case studies. You will formulate the business objective, manage the data, and perform analyses that you can use to optimize marketing, risk, and customer relationship management, as well as business processes and human resources. Topics include descriptive analysis, predictive modeling and analytics, customer segmentation, market analysis, share-of-wallet analysis, penetration analysis, and business intelligence.
This book is part of the SAS Press program.