This hands-on workshop is for D&A leaders seeking to unlock AI’s full potential as a professional co-pilot. Learn why mastering prompts is the first step to true AI fluency. Through live exercises focused on real-world D&A scenarios, you will learn the core techniques to build a more efficient and impactful analytics practice. Leave with a tactical toolkit of prompt engineering skills you can use immediately and a clear vision for your strategic AI value.
 talk-data.com
Topic
Analytics
data_analysis
insights
metrics
4552
tagged
Activity Trend
398
peak/qtr
2020-Q1
2026-Q2
Top Events
O'Reilly Data Science Books
528
O'Reilly Data Engineering Books
395
Moody's Talks - Inside Economics
283
Data Engineering Podcast
227
Data Career Podcast: Helping You Land a Data Analyst Job FAST
187
Data + AI Summit 2025
178
Databricks DATA + AI Summit 2023
170
The Analytics Power Hour
130
DataFramed
103
DATA MINER Big Data Europe Conference 2020
98
Secrets of Data Analytics Leaders
89
Dbt Coalesce 2024
87
Analytics and BI platforms and data Science and machine learning platforms are important technologies that drive insight-driven decision making and allow AI systems to be built and operationalized throughout the enterprise. This session unpacks the Magic Quadrants of both markets and gives inisght on the trends that you should be aware of.
Organizations often struggle to collaborate across analytic silos. By treating metrics as data products as part of a franchise delivery model, data leaders can improve the quality and consistency of analytic content across the organization.
AI is drastically changing how organizations do business and operate. As a result, data, analytics and AI must be approached differently, with a focus on value — the organizational capabilities, competencies and processes required to utilize AI and data to redesign workflows and enable decisions orchestrated by both people and machines in near real time. This session gets you grounded on the capabilities of the intelligent enterprise, why it is important and how to pivot toward this model.
To position their teams as a must-have discipline that can fulfill cross-functional use cases, D&A leaders must optimize their organizational model. The optimal model balances enterprisewide capabilities focused on enablement with decentralized needs focused on outcomes. Discover the design principles that underpin the ideal model and learn how to strike a balance between centralized consistency and decentralized agility.
This session will provide a blueprint for the comprehensive data, analytics, and AI capabilities and services that leaders need to build to enable their organization's AI ambition. It will explore the implications of your AI ambition archetype on your buying, deployment, and organization strategies.
AI is accelerating new possibilities for data and analytics everywhere. Success isn’t always about being the fastest, but about finding your own path to value, while managing risk and cost. Join our Gartner’s Opening Keynote to discover how a thoughtful approach to speed and direction helps you prepare for what’s next, no matter where you are today.
Data is the heartbeat of business. Microsoft's Fabric Analytics Engineer Associate (DP-600) certification proves you understand the tools and technologies to make use of it. This comprehensive guide covers everything you need to know to design and implement enterprise-grade analytics solutions—and ace your certification exam. Drawing on their extensive experience working with Microsoft Fabric and Power BI, Brian Bønk and Valerie Junk take you through preparing and transforming data, securing and managing analytics assets, and building and optimizing semantic models. You'll learn to work with data warehouses and lakehouses, ensuring data is structured and ready for analysis. You will also discover how to query and analyze data using SQL, KQL, and DAX, which are essential skills for anyone working with Fabric. Whether you're preparing for the exam or just looking to expand your Fabric expertise, this book gives you the foundation to succeed. Prepare and enrich data for analysis Work with, secure, and maintain analytics assets Implement and manage semantic models Utilize data warehouses and lakehouses Handle workspace access control and item-level access control Optimize enterprise-scale semantic models
Unlock the potential of your BIM workflows with artificial intelligence and data visualization tools. This book provides guided instruction on using software like Revit, Dynamo, Python, and Power BI to automate processes, derive insights, and craft tailored dashboards that empower data-driven decisions in AEC projects. What this Book will help me do Effectively preprocess and manage BIM data for analysis and visualization. Design interactive and insightful dashboards in Power BI for project stakeholders. Integrate real-time IoT data and advanced analytics into BIM projects. Automate repetitive tasks in Revit using Dynamo and Python scripting. Understand the ethical considerations and emerging trends in AI for BIM. Author(s) Bruno Martorelli, a seasoned BIM manager, specializes in integrating technology and data analytics into construction workflows. With a background in architecture and programming, he bridges the gap between traditional methods and modern innovations. Bruno is dedicated to sharing practical strategies for data automation and visualization. Who is it for? This book is tailored for architects, engineers, and construction managers interested in elevating their BIM practices. If you're familiar with Revit and possess a basic understanding of data management, you'll find this resource invaluable. Beginners in Python or Power BI will also find accessible guidance to start applying advanced techniques in their workflows.
Overview of monitoring agent activity using unified observability and analytics.
Monitoring agent activity with unified observability and analytics.
Do you want to create data analysis reports without writing a line of code? This book introduces SAS Studio, a free, web-based data science product for educational and non-commercial purposes. The power of SAS Studio lies in its visual, point-and-click user interface, which generates SAS code. It is easier to learn SAS Studio than to learn R and Python to accomplish data cleaning, statistics, and visualization tasks. The book includes a case study analyzing the data required to predict the results of presidential elections in the state of Maine for 2016 and 2020. In addition to the presidential elections, the book provides real-life examples, including analyses of stock, oil, and gold prices, crime, marketing, and healthcare. You will see data science in action and how easily it can be performed using complicated tasks and visualizations in SAS Studio. You will learn, step by step, how to perform visualizations, including creating maps. In most cases, you will not need a line of code as you work with the SAS Studio graphical user interface. The book includes explanations of the code that SAS Studio generates automatically. You will learn how to edit this code to perform more complicated advanced tasks. What You Will Learn Become familiar with the SAS Studio IDE. How to create essential visualizations. Know the fundamental statistical analysis required in most data science and analytics reports. Clean the most common dataset problems Learn linear and logistic regression for data prediction and analysis. Write programs in SAS. How to analyze data and get insights from it for decision-making. Learn character, numeric, date, time, and datetime functions and typecasting. Who This Book Is For A general audience of people who are new to data science, students, and data analysts and scientists who are new to SAS. No prior programming or statistical knowledge is required.
The book simplifies the complexities of cloud transition and offers a clear, actionable roadmap for organizations moving from SAP BW or BW/4HANA to SAP Datasphere and SAP Analytics Cloud (as part of SAP Business Data Cloud), particularly in alignment with S/4HANA transformation. Whether you are assessing your current landscape, building a business case with ROI analysis, or creating a phased implementation strategy, this book delivers both technical and strategic guidance. It highlights short- and long-term planning considerations, outlines migration governance, and provides best practices for managing projects across hybrid SAP environments. From identifying platform gaps to facilitating stakeholder discussions, this book is an essential resource for anyone involved in the analytics modernization journey. You Will: [if !supportLists] · [endif] Learn how to assess your current SAP BW or BW/4HANA landscape and identify key migration drivers [if !supportLists] · [endif] Understand best practices for leveraging out-of-the-box cloud features and AI/ML capabilities [if !supportLists] · [endif] A step-by-step approach to planning and executing the move to SAP Business Data Cloud (Mainly SAP Datasphere and SAP Analytics Cloud) This book is for: SAP BW/BW4HANA Customers, SAP Consultants, Solution Architects and Enterprise Architects
Unlock the secrets of practical data analysis with the Data Flow Map framework—a game-changing approach that transcends tools and platforms. This book isn’t just another programming manual; it’s a guide to thinking and communicating about data at a higher level. Whether you're working with spreadsheets, databases, or AI-driven models, you'll learn how to express your analytics in clear, common language that anyone can understand. In today’s data-rich world, clarity is the real challenge. Technical details often obscure insights that could drive real impact. The Data Flow Map framework simplifies complexity into three core motions: source, focus, and build. The first half of the book explores these concepts through illustrations and stories. The second half applies them to real-world datasets using tools like Excel, SQL, and Python, showing how the framework works across platforms and use cases. A vital resource for analysts at any level, this book offers a practical, tool-agnostic approach to data analysis. With hands-on examples and a universal mental model, you’ll gain the confidence to tackle any dataset, align your team, and deliver insights that matter. Whether you're a beginner or a seasoned pro, the Data Flow Map framework will transform how you approach data analytics. What You Will Learn Grasp essential elements applicable to every data analysis workflow Adapt quickly to any dataset, tool, or platform Master analytic thinking at a higher level Use analytics patterns to better understand the world Break complex analysis into manageable, repeatable steps Iterate faster to uncover deeper insights and better solutions Communicate findings clearly for better decision-making Who This Book Is For Aspiring data professionals and experienced analysts, from beginners to seasoned data engineers, focused on data collection, analysis, and decision making
Rivers have long been storytellers of human history. From the Nile to the Yangtze, they have shaped trade, migration, settlement, and the rise of civilizations. They reveal the traces of human ambition... and the costs of it. Today, from the Charles to the Golden Gate, US rivers continue to tell stories, especially through data.
Over the past decades, extensive water quality monitoring efforts have generated vast public datasets: millions of measurements of pH, dissolved oxygen, temperature, and conductivity collected across the country. These records are more than environmental snapshots; they are archives of political priorities, regulatory choices, and ecological disruptions. Ultimately, they are evidence of how societies interact with their environments, often unevenly.
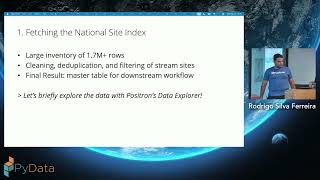
In this talk, I’ll explore how Python and modern data workflows can help us "listen" to these stories at scale. Using the United States Geological Survey (USGS) Water Data APIs and Remote SSH in Positron, I’ll process terabytes of sensor data spanning several years and regions. I’ll demonstrate that, while Parquet and DuckDB enable scalable exploration of historical records, using Remote SSH is paramount in order to enable large-scale data analysis. By doing so, I hope to answer some analytical questions that can surface patterns linked to industrial growth, regulatory shifts, and climate change.
By treating rivers as both ecological systems and social mirrors, we can begin to see how environmental data encodes histories of inequality, resilience, and transformation.
Whether your interest lies in data engineering, environmental analytics, or the human dimensions of climate and infrastructure, this talk will explore topics at the intersection of environmental science, will offer both technical methods and sociological lenses to understand the stories rivers continue to tell.
FootballBERT introduces a new way of representing football players — not as static IDs or statistical aggregates that fluctuate wildly over short periods, but as contextual embeddings learned directly from match data. Built on a Transformer architecture and trained through a Masked Player Prediction (MPP) objective, FootballBERT captures how a player’s identity emerges from teammates, opponents, and coaches tactical demands — much like BERT learns word meaning from sentences. Openly released on Hugging Face, FootballBERT is a plug-and-play foundation model whose embeddings can be integrated into any downstream system, paving the way for player-aware analytics across performance modeling, recruitment and prediction.
As organizations scale their analytics infrastructure, they deploy multiple Amazon Redshift clusters for workload isolation, cost attribution, and performance optimization. For each new cluster, teams must create databases linked to each data share and recreate permission policies locally. This fragmented approach becomes unmanageable as more clusters are brought online. Join us to learn how Amazon Redshift Federated Permissions removes this permission management complexity by providing centralized governance across multiple warehouses.
Learn more: More AWS events: https://go.aws/3kss9CP
Subscribe: More AWS videos: http://bit.ly/2O3zS75 More AWS events videos: http://bit.ly/316g9t4
ABOUT AWS: Amazon Web Services (AWS) hosts events, both online and in-person, bringing the cloud computing community together to connect, collaborate, and learn from AWS experts. AWS is the world's most comprehensive and broadly adopted cloud platform, offering over 200 fully featured services from data centers globally. Millions of customers—including the fastest-growing startups, largest enterprises, and leading government agencies—are using AWS to lower costs, become more agile, and innovate faster.
AWSreInvent #AWSreInvent2025 #AWS
In this 90 minute tutorial we'll get anyone with some basic Python and Command Line skills up and running with their own 100% laptop based set of LLMs, and explain some successful patterns for leveraging LLMs in a data analysis environment. We'll also highlight pit-falls waiting to catch you out, and encourage you that your pre-GenAI analytics skills are still relevant today and likely will be for the foreseeable future by demonstrating the limits of LLMs for data analysis tasks.
Unlocking the full potential of AI starts with your data, but real-world documents come in countless formats and levels of complexity. This session will give you hands-on experience with Docling, an open-source Python library designed to convert complex documents into AI-ready formats. Learn how Docling simplifies document processing, enabling you to efficiently harness all your data for downstream AI and analytics applications.
In this session, we will introduce AWS Analytics Model Context Protocol (MCP) Servers, including the Data Processing MCP Server and Amazon Redshift MCP Server, which enable agentic workflows across AWS Glue, Amazon EMR, Amazon Athena, and Amazon Redshift. You will learn how these open-source tools simplify complex analytics operations through natural language interactions with AI agents. We'll cover MCP server implementation strategies, real-world use cases, architectural patterns for deployment, and production best practices for building intelligent data engineering workflows that understand and orchestrate your analytics environment.
Learn more: More AWS events: https://go.aws/3kss9CP
Subscribe: More AWS videos: http://bit.ly/2O3zS75 More AWS events videos: http://bit.ly/316g9t4
ABOUT AWS: Amazon Web Services (AWS) hosts events, both online and in-person, bringing the cloud computing community together to connect, collaborate, and learn from AWS experts. AWS is the world's most comprehensive and broadly adopted cloud platform, offering over 200 fully featured services from data centers globally. Millions of customers—including the fastest-growing startups, largest enterprises, and leading government agencies—are using AWS to lower costs, become more agile, and innovate faster.