talk-data.com talk-data.com

Topic

BI

Business Intelligence (BI)

data_visualization reporting analytics

34

tagged

Activity Trend

111 peak/qtr
2020-Q1 2026-Q1

Activities

Showing filtered results

Filtering by: Databricks DATA + AI Summit 2023 ×
Building an Analytics Lakehouse at Grab

Grab shares the story of their Lakehouse journey, from the drivers behind their shift to this new paradigm, to lessons learned along the way. From a starting point of a siloed, data warehouse centric architecture that had inherent challenges with scalability, performance and data duplication, Grab has standardized upon Databricks to serve as an open and unified Lakehouse platform to deliver insights at scale, democratizing data through the rapid deployment of AI and BI use cases across their operations.

Connect with us: Website: https://databricks.com Facebook: https://www.facebook.com/databricksinc Twitter: https://twitter.com/databricks LinkedIn: https://www.linkedin.com/company/data... Instagram: https://www.instagram.com/databricksinc/

Predicting Repeat Admissions to Substance Abuse Treatment with Machine Learning

In our presentation, we will walk through a model created to predict repeat admissions to substance abuse treatment centers. The goal is to predict early who will be at high risk for relapse so care can be tailored to put additional focus on these patients. We used the Treatment Episode Data Set (TEDS) Admissions data set, which includes every publicly funded substance abuse treatment admission in the US.

While longitudinal data is not available in the data set, we were able to predict with 88% accuracy and an f-score of 0.85 which admissions were first or repeat admissions. Our solution used a scikit-learn Random Forest model and leveraged MLFlow to track model metrics to choose the most effective model. Our pipeline tested over 100 models of different types ranging from Gradient Boosted Trees to Deep Neural Networks in Tensorflow.

To improve model interpretability, we used Shapley values to measure which variables were most important for predicting readmission. These model metrics along with other valuable data are visualized in an interactive Power BI dashboard designed to help practitioners understand who to focus on during treatment. We are in discussions with companies and researchers who may be able to leverage this model in substance abuse treatment centers in the field.

Connect with us: Website: https://databricks.com Facebook: https://www.facebook.com/databricksinc Twitter: https://twitter.com/databricks LinkedIn: https://www.linkedin.com/company/data... Instagram: https://www.instagram.com/databricksinc/

Scaling Your Workloads with Databricks Serverless

Databricks SQL provides a first-class user experience for BI and SQL directly on the lakehouse platform. But you still need to administer and maintain clusters of virtual machines. What if you could focus on your Databricks SQL queries and never need to worry about the underlying compute infrastructure? Learn how Databricks Serverless, built into the Databricks Lakehouse Platform, eliminates cluster management, provides instant compute, and lowers total cost of ownership for Databricks SQL. In this session, you will see demos, hear from customers, learn how Databricks Serverless works under the hood, be equipped with everything you need to get started – and ultimately get the best out of Databricks Serverless.

Connect with us: Website: https://databricks.com Facebook: https://www.facebook.com/databricksinc Twitter: https://twitter.com/databricks LinkedIn: https://www.linkedin.com/company/data... Instagram: https://www.instagram.com/databricksinc/

Building Spatial Applications with Apache Spark and CARTO

CARTO’s Spatial Extension provides the fundamental building blocks for Location Intelligence in Databricks. Many of the largest organizations using CARTO leverage Databricks for their analytics. Customers very often build custom spatial applications that simplify either a spatial analysis use case or provide a more direct interface to access business intelligence or information. CARTO facilitates the creation of these apps with a complete set of development libraries and APIs. For visualization, CARTO makes use of the powerful deck.gl visualization library. You utilize CARTO Builder to design your maps and perform analytics using Spatial SQL similar to PostGIS, but with the scalability of Apache Spark and then you reference them in your code. CARTO will handle visualizing large datasets, updating the maps, and everything in between. In this talk we will walk you through the process to build spatial applications with CARTO hosted in Apache Spark.

Connect with us: Website: https://databricks.com Facebook: https://www.facebook.com/databricksinc Twitter: https://twitter.com/databricks LinkedIn: https://www.linkedin.com/company/data... Instagram: https://www.instagram.com/databricksinc/

Unity Catalog: Journey to Unified Governance for Your Data and AI Assets on Lakehouse

Modern data assets take many forms: not just files or tables, but dashboards, ML models, and unstructured data like video and images, all of which cannot be governed and managed by legacy data governance solutions. Join this session to learn how data teams can use Unity Catalog to centrally manage all data and AI assets with a common governance model based on familiar ANSI SQL, ensuring much better native performance and security. Built-in automated data lineage provides end-to-end visibility into how data flows from source to consumption, so that organizations can identify and diagnose the impact of data changes. Unity Catalog delivers the flexibility to leverage existing data catalogs and solutions and establish a future-proof, centralized governance without expensive migration costs. It also creates detailed audit reports for data compliance and security, while ensuring data teams can quickly discover and reference data for BI, analytics, and ML workloads, accelerating time to value.

Connect with us: Website: https://databricks.com Facebook: https://www.facebook.com/databricksinc Twitter: https://twitter.com/databricks LinkedIn: https://www.linkedin.com/company/data... Instagram: https://www.instagram.com/databricksinc/

Enabling BI in a Lakehouse Environment: How Spark and Delta Can Help With Automating a DWH Develop

Traditional data warehouses typically struggle when it comes to handling large volumes of data and traffic, particularly when it comes to unstructured data. In contrast, data lakes overcome such issues and have become the central hub for storing data. We outline how we can enable BI Kimball data modelling in a Lakehouse environment.

We present how we built a Spark-based framework to modernize DWH development with data lake as central storage, assuring high data quality and scalability. The framework was implemented at over 15 enterprise data warehouses across Europe.

We present how one can tackle in Spark & with Delta Lake the data warehouse principles like surrogate, foreign and business keys, SCD type 1 and 2 etc. Additionally, we share our experiences on how such a unified data modelling framework can bridge BI with modern day use cases, such as machine learning and real time analytics. The session outlines the original challenges, the steps taken and the technical hurdles we faced.

Connect with us: Website: https://databricks.com Facebook: https://www.facebook.com/databricksinc Twitter: https://twitter.com/databricks LinkedIn: https://www.linkedin.com/company/data... Instagram: https://www.instagram.com/databricksinc/

You Have BI. Now What? Activate Your Data!

Analytics has long been the end goal for data teams— standing up dashboards and exporting reports for business teams. But what if data teams could extend their work directly into the tools business teams use?

The next evolution for data teams is Activation. Smart organizations use reverse ETL to extend the value of Databricks by syncing data directly into business platforms, making their lakehouse a Customer Data Platform (CDP). By making Databricks the single source of truth for your data, you can create business models in your lakehouse and serve them directly to your marketing tools, ad networks, CRMs, and more. This saves time and money, unlocks new use cases for your data and turns data team efforts into revenue generating activities.

Connect with us: Website: https://databricks.com Facebook: https://www.facebook.com/databricksinc Twitter: https://twitter.com/databricks LinkedIn: https://www.linkedin.com/company/data... Instagram: https://www.instagram.com/databricksinc/

Your fastest path to Lakehouse and beyond

Azure Databricks is an easy, open, and collaborative service for data, analytics & AI use cases, enabled by Lakehouse architecture. Join this session to discover how you can get the most out of your Azure investments by combining the best of Azure Synapse Analytics, Azure Databricks and Power BI for building a complete analytics & AI solution based on Lakehouse architecture.

Connect with us: Website: https://databricks.com Facebook: https://www.facebook.com/databricksinc Twitter: https://twitter.com/databricks LinkedIn: https://www.linkedin.com/company/data... Instagram: https://www.instagram.com/databricksinc/

Data Warehousing on the Lakehouse

Most organizations routinely operate their business with complex cloud data architectures that silo applications, users and data. As a result, there is no single source of truth of data for analytics, and most analysis is performed with stale data. To solve these challenges, the lakehouse has emerged as the new standard for data architecture, with the promise to unify data, AI and analytic workloads in one place. In this session, we will cover why the data lakehouse is the next best data warehouse. You will hear from the experts success stories, use cases, and best practices learned from the field and discover how the data lakehouse ingests, stores and governs business-critical data at scale to build a curated data lake for data warehousing, SQL and BI workloads. You will also learn how Databricks SQL can help you lower costs and get started in seconds with instant, elastic SQL serverless compute, and how to empower every analytics engineers and analysts to quickly find and share new insights using their favorite BI and SQL tools, like Fivetran, dbt, Tableau or PowerBI.

Connect with us: Website: https://databricks.com Facebook: https://www.facebook.com/databricksinc Twitter: https://twitter.com/databricks LinkedIn: https://www.linkedin.com/company/data... Instagram: https://www.instagram.com/databricksinc/

Delta Live Tables: Modern Software Engineering and Management for ETL

Data engineers have the difficult task of cleansing complex, diverse data, and transforming it into a usable source to drive data analytics, data science, and machine learning. They need to know the data infrastructure platform in depth, build complex queries in various languages and stitch them together for production. Join this talk to learn how Delta Live Tables (DLT) simplifies the complexity of data transformation and ETL. DLT is the first ETL framework to use modern software engineering practices to deliver reliable and trusted data pipelines at any scale. Discover how analysts and data engineers can innovate rapidly with simple pipeline development and maintenance, how to remove operational complexity by automating administrative tasks and gaining visibility into pipeline operations, how built-in quality controls and monitoring ensure accurate BI, data science, and ML, and how simplified batch and streaming can be implemented with self-optimizing and auto-scaling data pipelines.

Connect with us: Website: https://databricks.com Facebook: https://www.facebook.com/databricksinc Twitter: https://twitter.com/databricks LinkedIn: https://www.linkedin.com/company/data... Instagram: https://www.instagram.com/databricksinc/

Evolution of Data Architectures and How to Build a Lakehouse

Data architectures are the key and part of a larger picture to building robust analytical and AI applications. One must take a holistic view of the entire data analytics realm when it comes to planning for data science initiatives.

Through this talk, learn about the evolution of the data landscape and why Lakehouses are becoming a de facto for organizations building scalable data architectures. A lakehouse architecture combines data management capability including reliability, integrity, and quality from the data warehouse and supports all data workloads including BI and AI with the low cost and open approach of data lakes.

Data Practitioners will also learn some core concepts of building an efficient Lakehouse with Delta Lake.

Connect with us: Website: https://databricks.com Facebook: https://www.facebook.com/databricksinc Twitter: https://twitter.com/databricks LinkedIn: https://www.linkedin.com/company/data... Instagram: https://www.instagram.com/databricksinc/

Cloud Fetch: High-bandwidth Connectivity With BI Tools

Business Intelligence (BI) tools such as Tableau and Microsoft Power BI are notoriously slow at extracting large query results from traditional data warehouses because they typically fetch the data in a single thread through a SQL endpoint that becomes a data transfer bottleneck. Data analysts can connect their BI tools to Databricks SQL endpoints to query data in tables through an ODBC/JDBC protocol integrated in our Simba drivers. With Cloud Fetch, which we released in Databricks Runtime 8.3 and Simba ODBC 2.6.17 driver, we introduce a new mechanism for fetching data in parallel via cloud storage such as AWS S3 and Azure Data Lake Storage to bring the data faster to BI tools. In our experiments using Cloud Fetch, we observed a 10x speed-up in extract performance due to parallelism.

Connect with us: Website: https://databricks.com Facebook: https://www.facebook.com/databricksinc Twitter: https://twitter.com/databricks LinkedIn: https://www.linkedin.com/company/data... Instagram: https://www.instagram.com/databricksinc/

Databricks Meets Power BI

Databricks and Spark are becoming increasingly popular and are now used as a modern data platform to analyze real-time or batch data. In addition, Databricks offers a great integration for machine learning developers.

Power BI, on the other hand, is a great platform for easy graphical analysis of data, and it's a great way to bring hundreds of different data sources together, analyze them together and make them accessible on any device.

So let's just bring both worlds together and see how well Databricks works with Power BI.

Connect with us: Website: https://databricks.com Facebook: https://www.facebook.com/databricksinc Twitter: https://twitter.com/databricks LinkedIn: https://www.linkedin.com/company/data... Instagram: https://www.instagram.com/databricksinc/

How the Largest County in the US is Transforming Hiring with a Modern Data Lakehouse

Los Angeles County’s Department of Human Resources (DHR) is responsible for attracting a diverse workforce for the 37 departments it supports. Each year, DHR processes upwards of 400,000 applications for job opportunities making it one of the largest employers in the nation. Managing a hiring process of this scale is complex with many complicated factors such as background checks and skills examination. These processes, if not managed properly, can create bottlenecks and a poor experience for both candidates and hiring managers.

In order to identify areas for improvement, DHR set out to build detailed operational metrics across each stage of the hiring process. DHR used to conduct high level analysis manually using excel and other disparate tools. The data itself was limited, difficult to obtain, and analyze. In addition, it was taking analysts weeks to manually pull data from half a dozen siloed systems into excel for cleansing and analysis. This process was labor-intensive, inefficient, and prone to human error.

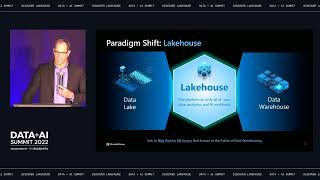
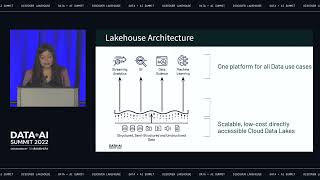
To overcome these challenges, DHR in partnership with Internal Services Department (ISD) adopted a modern data architecture in the cloud. Powered by the Azure Databricks Lakehouse, DHR was able to bring together their diverse volumes of data into a single platform for data analytics. Manual ETL processes that took weeks could now be automated in 10 minutes or less. With this new architecture, DHR has built Business Intelligence dashboards to unpack the hiring process to get a clear picture of where the bottlenecks are and track the speed with which candidates move through the process The dashboards allow the County departments innovate and make changes to enhance and improve the experience of potential job seekers and improve the timeliness of securing highly qualified and diverse County personnel at all employment levels.

In this talk, we’ll discuss DHR’s journey towards building a data-driven hiring process, the architecture decisions that enabled this transformation and the types of analytics that we’ve deployed to improve hiring efforts.

Connect with us: Website: https://databricks.com Facebook: https://www.facebook.com/databricksinc Twitter: https://twitter.com/databricks LinkedIn: https://www.linkedin.com/company/data... Instagram: https://www.instagram.com/databricksinc/