Build new analytics and AI models and supercharge your intelligent app strategy across your organization. Increase developer velocity with Copilot in Fabric and empower your data scientists and data analysts with Semantic Link, bridging the world of business intelligence and AI. Train custom ML models with Azure ML and Fabric Data Science, democratizing AI across lines-of-business and increasing collaboration between data professionals and ML professionals.
To learn more, please check out these resources: * https://aka.ms/Ignite23CollectionsBRK225H * https://info.microsoft.com/ww-landing-contact-me-for-events-m365-in-person-events.html?LCID=en-us&ls=407628-contactme-formfill * https://aka.ms/azure-ignite2023-dataaiblog
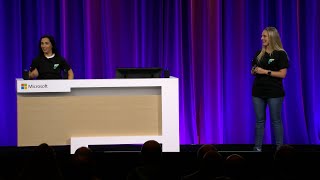
𝗦𝗽𝗲𝗮𝗸𝗲𝗿𝘀: * Justyna Lucznik * Nellie Gustafsson * Misha Desai * Thasmika Gokal * Abhishek Narain * Alex Powers * Alex van Grootel * Ed Donahue * Lukasz Pawlowski * Raj RIkhy * Wilson Lee
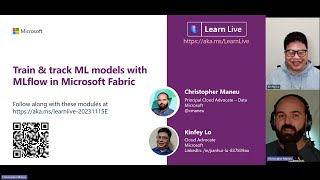
𝗦𝗲𝘀𝘀𝗶𝗼𝗻 𝗜𝗻𝗳𝗼𝗿𝗺𝗮𝘁𝗶𝗼𝗻: This video is one of many sessions delivered for the Microsoft Ignite 2023 event. View sessions on-demand and learn more about Microsoft Ignite at https://ignite.microsoft.com
BRK225 | English (US) | Data