 talk-data.com
Topic
Data Science
machine_learning
statistics
analytics
1516
tagged
Activity Trend
68
peak/qtr
2020-Q1
2026-Q2
Top Events
O'Reilly Data Science Books
324
DATA MINER Big Data Europe Conference 2020
107
DataFramed
101
O'Reilly Data Engineering Books
84
DataTalks.Club
66
Data Engineering Podcast
59
Data Hackers
54
The Future of Data Podcast | conversation with leaders, influencers, and change makers in the World of Data & Analytics
44
Databricks DATA + AI Summit 2023
43
Data Skeptic
39
Data Career Podcast: Helping You Land a Data Analyst Job FAST
38
Making Data Simple
37
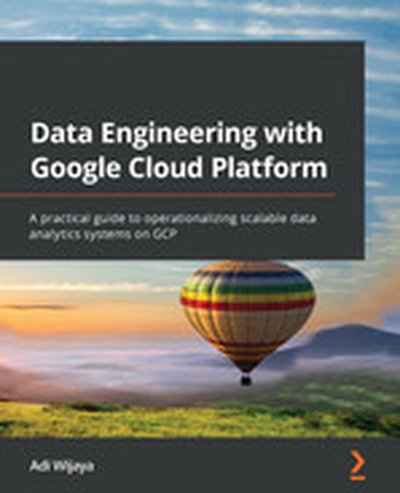
In 'Data Engineering with Google Cloud Platform', you'll explore how to construct efficient, scalable data pipelines using GCP services. This hands-on guide covers everything from building data warehouses to deploying machine learning pipelines, helping you master GCP's ecosystem. What this Book will help me do Build comprehensive data ingestion and transformation pipelines using BigQuery, Cloud Storage, and Dataflow. Design end-to-end orchestration flows with Airflow and Cloud Composer for automated data processing. Leverage Pub/Sub for building real-time event-driven systems and streaming architectures. Gain skills to design and manage secure data systems with IAM and governance strategies. Prepare for and pass the Professional Data Engineer certification exam to elevate your career. Author(s) Adi Wijaya is a seasoned data engineer with significant experience in Google Cloud Platform products and services. His expertise in building data systems has equipped him with insights into the real-world challenges data engineers face. Adi aims to demystify technical topics and deliver practical knowledge through his writing, helping tech professionals excel. Who is it for? This book is tailored for data engineers and data analysts who want to leverage GCP for building efficient and scalable data systems. Readers should have a beginner-level understanding of topics like data science, Python, and Linux to fully benefit from the material. It is also suitable for individuals preparing for the Google Professional Data Engineer exam. The book is a practical companion for enhancing cloud and data engineering skills.
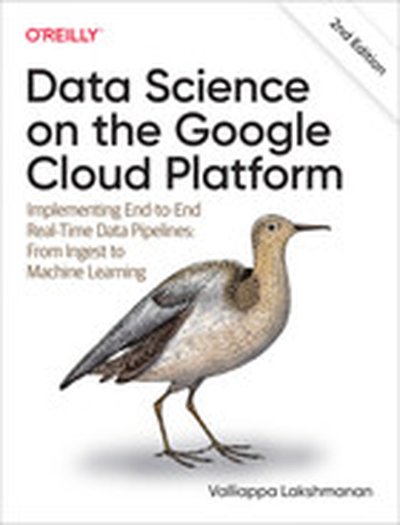
Learn how easy it is to apply sophisticated statistical and machine learning methods to real-world problems when you build using Google Cloud Platform (GCP). This hands-on guide shows data engineers and data scientists how to implement an end-to-end data pipeline with cloud native tools on GCP. Throughout this updated second edition, you'll work through a sample business decision by employing a variety of data science approaches. Follow along by building a data pipeline in your own project on GCP, and discover how to solve data science problems in a transformative and more collaborative way. You'll learn how to: Employ best practices in building highly scalable data and ML pipelines on Google Cloud Automate and schedule data ingest using Cloud Run Create and populate a dashboard in Data Studio Build a real-time analytics pipeline using Pub/Sub, Dataflow, and BigQuery Conduct interactive data exploration with BigQuery Create a Bayesian model with Spark on Cloud Dataproc Forecast time series and do anomaly detection with BigQuery ML Aggregate within time windows with Dataflow Train explainable machine learning models with Vertex AI Operationalize ML with Vertex AI Pipelines
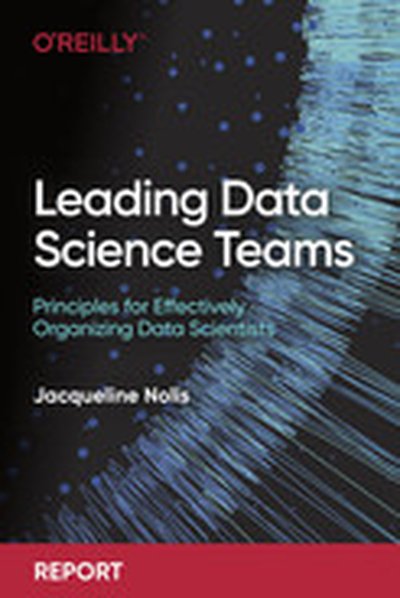
Compared to other functions of an organization, data science is highly speculative. Data science teams are often tasked with last-minute must-have deliverables that are well beyond their ability to produce. Data might be missing or have no signal, or the data models themselves might be impractical. This hands-on reference guides team leaders through the types of challenges you might face and the tools you need to work through them. Author Jacqueline Nolis, head of data science at Saturn Cloud, helps team leaders think through the various issues you'll encounter when running a data science team. You'll learn ways to set up your team, manage data scientists to promote their success, and collaborate with external stakeholders. Once you finish this report, you'll be ready to work through the challenges your current team faces or start a new data science team in an organization that needs one. Determine the scope of work before choosing your team of data scientists and support positions Successfully manage your relationship with stakeholders by providing your team with clear, achievable goals Create an environment to help data scientists and other team members succeed Choose a technical infrastructure for your team, including programming languages, databases, and deployment models
For Danielle Crop, the Chief Data Officer of Albertsons, to draw distinctions between “digital” and “data” only limits the ability of an organization to create useful products. One of the reasons I asked Danielle on the show is due to her background as a CDO and former SVP of digital at AMEX, where she also managed product and design groups. My theory is that data leaders who have been exposed to the worlds of software product and UX design are prone to approach their data product work differently, and so that’s what we dug into this episode. It didn’t take long for Danielle to share how she pushes her data science team to collaborate with business product managers for a “cross-functional, collaborative” end result. This also means getting the team to understand what their models are personalizing, and how customers experience the data products they use. In short, for her, it is about getting the data team to focus on “outcomes” vs “outputs.”
Scaling some of the data science and ML modeling work at Albertsons is a big challenge, and we talked about one of the big use cases she is trying to enable for customers, as well as one “real-life” non-digital experience that her team’s data science efforts are behind.
The big takeaway for me here was hearing how a CDO like Danielle is really putting customer experience and the company’s brand at the center of their data product work, as opposed solely focusing on ML model development, dashboard/BI creation, and seeing data as a raw ingredient that lives in a vacuum isolated from people.
In this episode, we cover:
Danielle’s take on the “D” in CDO: is the distinction between “digital” and “data” even relevant, especially for a food and drug retailer? (01:25) The role of data product management and design in her org and how UX (i.e. shopper experience) is influenced by and considered in her team’s data science work (06:05) How Danielle’s team thinks about “customers” particularly in the context of internal stakeholders vs. grocery shoppers (10:20) Danielle’s current and future plans for bringing her data team into stores to better understand shoppers and customers (11:11) How Danielle’s data team works with the digital shopper experience team (12:02) “Outputs” versus “Outcomes” for product managers, data science teams, and data products (16:30) Building customer loyalty, in-store personalization, and long term brand interaction with data science at Albertsons (20:40) How Danielle and her team at Albertsons measure the success of their data products (24:04) Finding the problems, building the solutions, and connecting the data to the non-technical side of the company (29:11)
Quotes from Today’s Episode “Data always comes from somewhere, right? It always has a source. And in our modern world, most of that source is some sort of digital software. So, to distinguish your data from its source is not very smart as a data scientist. You need to understand your data very well, where it came from, how it was developed, and software is a massive source of data. [As a CDO], I think it’s not important to distinguish between [data and digital]. It is important to distinguish between roles and responsibilities, you need different skills for these different areas, but to create an artificial silo between them doesn’t make a whole lot of sense to me.”- Danielle (03:00)
“Product managers need to understand what the customer wants, what the business needs, how to pass that along to data scientists and data scientists, and to understand how that’s affecting business outcomes. That’s how I see this all working. And it depends on what type of models they’re customizing and building, right? Are they building personalization models that are going to be a digital asset? Are they building automation models that will go directly to some sort of operational activity in the store? What are they trying to solve?” - Danielle (06:30)
“In a company that sells products—groceries—to individuals, personalization is a huge opportunity. How do we make that experience, both in-digital and in-store, more relevant to the customer, more sticky and build loyalty with those customers? That’s the core problem, but underneath that is you got to build a lot of models that help personalize that experience. When you start talking about building a lot of different models, you need scale.” - Danielle (9:24)
“[Customer interaction in the store] is a true big data problem, right, because you need to use the WiFi devices, et cetera. that you have in store that are pinging the devices at all times, and it’s a massive amount of data. Trying to weed through that and find the important signals that help us to actually drive that type of personalized experience is challenging. No one’s gotten there yet. I hope that we’ll be the first.” - Danielle (19:50)
“I can imagine a checkout clerk who doesn’t want to talk to the customer, despite a data-driven suggestion appearing on the clerk’s monitor as to how to personalize a given customer interaction. The recommendation suggested to the clerk may be ‘accurate from a data science point of view, but if the clerk doesn’t actually act on it, then the data product didn’t provide any value. When I train people in my seminar, I try to get them thinking about that last mile. It may not be data science work, and maybe you have a big enough org where that clerk/customer experience is someone else’s responsibility, but being aware that this is a fault point and having a cross-team perspective is key.” - Brian @rhythmspice (24:50)
“We’re going through a moment in time in which trust in data is shaky. What I’d like people to understand and know on a broader philosophical level, is that in order to be able to understand data and use it to make decisions, you have to know its source. You have to understand its source. You have to understand the incentives around that source of data….you have to look at the data from the perspective of what it means and what the incentives were for creating it, and then analyze it, and then give an output. And fortunately, most statisticians, most data scientists, most people in most fields that I know, are incredibly motivated to be ethical and accurate in the information that they’re putting out.” - Danielle (34:15)
The data journey is a slow painstaking process. But knowing where to start and the areas to focus on can help any organization reach its goals faster.
Today’s guest, Vijay Yadav, Director of Quantitative Sciences & Head of Data Science at the Center for Mathematical Sciences at Merck, explains the 6 key elements of data strategy, complete with advice on how to navigate each.
Join us as we discuss:
The different components of a data strategy Shifting mindset within the C-Suite Structuring the operating model Enabling people to work with data at scale Most effective tactics to kickstart a community around data science
Find every episode of DataFramed on Apple, Spotify, and more. Find us on our website and join the conversation on LinkedIn.
Listening on a desktop and can’t see the links? Just search for DataFramed in your favorite podcast player.
Dive into the world of reproducible data science with Pachyderm, a specialized platform designed for version-controlled data pipelines. By following this book, 'Reproducible Data Science with Pachyderm,' you'll gain the skills to implement robust, scalable machine learning workflows with Pachyderm 2.0, covering setup, integration, and advanced use cases. What this Book will help me do Build scalable, version-controlled data pipelines with Pachyderm's unique features. Understand the principles behind reproducible data science and implement them effectively. Deploy Pachyderm on AWS, Google Cloud, and Azure while integrating with popular tools. Create and manage end-to-end machine learning workflows, including hyperparameter tuning. Leverage advanced integrations, such as Pachyderm Notebooks and language clients like Python and Go. Author(s) Svetlana Karslioglu is a seasoned data scientist with extensive experience in constructing scalable machine learning and data processing systems. With years in both practical implementation and educational endeavors, she has a talent for breaking down complex concepts into accessible learning paths. Her approach is hands-on and results-oriented, aimed at empowering professionals to excel in the field of data science. Who is it for? This book is intended for data scientists, machine learning engineers, and data engineers who are keen to ensure reproducibility in their workflows. Ideal readers may have familiarity with data science basics and some exposure to Kubernetes and programming languages like Python. By studying the book, learners will establish confidence in implementing Pachyderm for scalable and reliable data pipelines.
Ever heard of ‘synthetic data’? Synthetic data is data that is artificially created (from statistical models), rather than generated by actual events. It contains all the characteristics of production data, minus the sensitive stuff. By 2024, 60% of the data used for the development of AI and analytics projects will be synthetically generated, according to Gartner. The reason organisations may use synthetic data over actual data is because you can get it more quickly, easily and cheaply. But there are concerns with this approach, because synthetic data is based on models and algorithms designed by humans and their biases. More data doesn’t necessarily equal better data. Is synthetic data a brilliant tool for improving data quality, reducing data acquisition costs, managing privacy and reducing overfitting? Or does synthetic data put us on a slippery slope of hard-to-interrogate models that are technically replacing fact with fiction? To answer these questions, I recently spoke to Minhaaj Rehman, who is CEO & Chief Data Scientist at Psyda, an AI-enabled academic and industrial research agency. In this episode of Leaders of Analytics, you will learn: What synthetic data is and how it is generatedThe most common uses for synthetic dataThe arguments for and against using synthetic dataWhen synthetic data is most helpful and when it is most riskyHow to implement best practices for mitigating the risks associated with synthetic data, and much more.Episode timestamps: 00:00 Intro 03:00 What Psyda Does 04:23 Academic Work and Modern Education 06:38 Getting into Data Science 11:30 What is Synthetic Data 13:30 Common Applications for Synthetic Data 18:50 Pros & Cons of using Synthetic Data 21:29 Risks of using Synthetic Data 23:48 When should Synthetic Data be Used 29:23 Synthetic Data is Cleaner than Real Data 34:05 Using Synthetic Data for Risk Mitigation 36:05 Resources on Learning More about Synthetic Data 38:05 Human Biases in Decision Making Connect with Minhaaj: Minhaaj on LinkedIn: https://www.linkedin.com/in/minhaaj/ Minhaaj's website and podcast: https://minhaaj.com/
Think big about your data! PySpark brings the powerful Spark big data processing engine to the Python ecosystem, letting you seamlessly scale up your data tasks and create lightning-fast pipelines. In Data Analysis with Python and PySpark you will learn how to: Manage your data as it scales across multiple machines Scale up your data programs with full confidence Read and write data to and from a variety of sources and formats Deal with messy data with PySpark’s data manipulation functionality Discover new data sets and perform exploratory data analysis Build automated data pipelines that transform, summarize, and get insights from data Troubleshoot common PySpark errors Creating reliable long-running jobs Data Analysis with Python and PySpark is your guide to delivering successful Python-driven data projects. Packed with relevant examples and essential techniques, this practical book teaches you to build pipelines for reporting, machine learning, and other data-centric tasks. Quick exercises in every chapter help you practice what you’ve learned, and rapidly start implementing PySpark into your data systems. No previous knowledge of Spark is required. About the Technology The Spark data processing engine is an amazing analytics factory: raw data comes in, insight comes out. PySpark wraps Spark’s core engine with a Python-based API. It helps simplify Spark’s steep learning curve and makes this powerful tool available to anyone working in the Python data ecosystem. About the Book Data Analysis with Python and PySpark helps you solve the daily challenges of data science with PySpark. You’ll learn how to scale your processing capabilities across multiple machines while ingesting data from any source—whether that’s Hadoop clusters, cloud data storage, or local data files. Once you’ve covered the fundamentals, you’ll explore the full versatility of PySpark by building machine learning pipelines, and blending Python, pandas, and PySpark code. What's Inside Organizing your PySpark code Managing your data, no matter the size Scale up your data programs with full confidence Troubleshooting common data pipeline problems Creating reliable long-running jobs About the Reader Written for data scientists and data engineers comfortable with Python. About the Author As a ML director for a data-driven software company, Jonathan Rioux uses PySpark daily. He teaches the software to data scientists, engineers, and data-savvy business analysts. Quotes A clear and in-depth introduction for truly tackling big data with Python. - Gustavo Patino, Oakland University William Beaumont School of Medicine The perfect way to learn how to analyze and master huge datasets. - Gary Bake, Brambles Covers both basic and more advanced topics of PySpark, with a good balance between theory and hands-on. - Philippe Van Bergenl, P² Consulting For beginner to pro, a well-written book to help understand PySpark. - Raushan Kumar Jha, Microsoft
by
Ellen König
We talked about:
Ellen’s background Why Ellen switched from data science to data engineering The overlap between data science and data engineering Skills to learn and improve for data engineering Ways to pick up and improve skills (advice for making the transition) What makes a data engineering course “good” Languages to know for data engineering The easiest part of transitioning into data engineering The hardest part of transitioning into data engineering Common data engineering team distributions People who are both data scientists and data engineers Pet projects and other ways to pick up development skills Dealing with cloud processing costs (alerts, billing reports, trial periods) Advice for getting into entry level positions Which cloud platform should data engineers learn?
Links:
Twitter: https://twitter.com/ellen_koenig LinkedIn: https://www.linkedin.com/in/ellenkoenig/
Join DataTalks.Club: https://datatalks.club/slack.html
Our events: https://datatalks.club/events.html
Is AI good or bad? That would depend on how AI is applied. AI is a revolutionary capability with the power to do a lot of good and plenty of bad, on purpose or by omission. In order for AI to become a social good that improves our lives in broad terms, we must necessarily pick the right use cases and design solutions with a strong focus on ethics and privacy. So, how is AI being used for social good today, and how do we ensure the important topics of ethics and privacy are front and centre for those designing AI solutions? To answer these questions and many more relating to using data for good, I recently spoke to Dr Alex Antic. Alex is the Managing Director of the Dr Alex Antic Group and an award-winning data & analytics leader with a truly impressive CV spanning across quantitative finance, insurance, academia, several federal government departments and consulting as well as advisory and board roles. In this episode of Leaders of Analytics, we cover: The role data, data science and AI can and should play in societyExamples of how AI is being used for social goodHow public entities ensure people’s privacy is maintained, including the use of Privacy Enhancing TechnologiesThe most important data science and AI skills for us to foster as a societyHow Alex is teaching future data leaders to make ethical design choices, and much more.Dr Alex Antic website: https://dralexantic.com/ Dr Alex Antic LinkedIn profile: https://www.linkedin.com/in/dralexantic/
It’s no secret that data science jobs are on the rise; but data skills across the board are rising — leading to what today’s guest calls “hybrid jobs.”
This will require a paradigm shift in how we think about jobs and skills.
Today’s guest, Matt Sigelman, President of The Burning Glass Institute & Chairman of Emsi Burning Glass, talks about the difficulties of connecting companies with top talent, the hybridization of many positions, and how to position yourself in the ever-changing market.
Join us as we discuss:
The methodology of using data science on the labor market The demand for data skills & how they’re evolving Blending skills to get ahead in the job market & the rise of subskills How educational institutions can prepare students for hybridization Advice to the audience on how to structure their approach to skill acquisition
Find every episode of DataFramed on Apple, Spotify, and more. Find us on our website and join the conversation on LinkedIn.
Listening on a desktop and can’t see the links? Just search for DataFramed in your favorite podcast player.
Data is eating the world and every industry is impacted. In most modern businesses, customer and employee activities create a plethora of data points and information that can be analysed and interpreted to make better decisions for the business and its customers. Unfortunately, this sounds a lot easier than it is. Despite the huge mountains of data being created, many organisations struggle to get their business intelligence to serve them in the best way. This is not due to a shortage of reports and dashboard floating around – in many cases there are too many ways to get an answer to the same question. So, why are so many organisations lacking good BI and what should they do about it? I recently spoke to Jen Stirrup to get an answer to this question and many more relating to producing and consuming business intelligence effectively. Jen is the CEO & Founder of Data Relish, a global AI, Data Science and Business Intelligence Consultancy. She is a leading authority in AI and Business Intelligence Leadership and has been named one of the Top 50 Global Data Visionaries and Top 50 Women in Technology worldwide. In this episode of Leaders of Analytics, you will learn how to avoid data paralysis and discover how to create business intelligence that gives your organisation new superpowers. Jen's website: https://jenstirrup.com/ Jen's LinkedIn profile: https://www.linkedin.com/in/jenstirrup/ Jen on Twitter: https://twitter.com/jenstirrup
by
Avery Smith
Welcome to the show notes! 🎉 I always put interesting things in the show notes, so make sure you check them every episode!
In today's podcast episode, I'll be sharing a recording of a seminar I gave this week to about 50 undergraduate students, specifically in the chemical engineering program at the University of Utah.
I'll be talking about: 1) what I wish I knew while I was in college and trying to break into data science 2) how data science can be applied in industrial systems and engineering
Although this was given to a live audience, I do think a lot of the advice you might find applicable to you and your situation.
Want to come to my project analyzing Ken Jee's YouTube data? Register here: https://www.linkedin.com/video/event/urn:li:ugcPost:6899114723149705216/
If you want a free way to kickstart your analytics career, check out my free 33-page PDF giving you an introduction to everything you need to know: https://www.datacareerjumpstart.com/roadmap
If you’re just starting out, you can check out my 21 Day To Data Challenge: https://www.datacareerjumpstart.com/challenge
Want to learn data science while building your portfolio? Check out Data Career Jumpstart: https://www.datacareerjumpstart.com/data-career-jumpstart-course
MORE DATA ANALYTICS CONTENT HERE:
📺 Subscribe YouTube: https://www.youtube.com/c/AverySmithDataCareerJumpstart/videos
🎙Listen to My Podcast: https://podcasts.apple.com/us/podcast/data-career-podcast/id1547386535
👔 Connect with me on LinkedIn: https://www.linkedin.com/in/averyjsmith/
📸 Instagram: https://www.instagram.com/datacareerjumpstart/
👾Join My Discord: https://www.datacareerjumpstart.com/discord
🎵 TikTok: https://www.tiktok.com/@verydata?
Mentioned in this episode: Join the last cohort of 2025! The LAST cohort of The Data Analytics Accelerator for 2025 kicks off on Monday, December 8th and enrollment is officially open!
To celebrate the end of the year, we’re running a special End-of-Year Sale, where you’ll get: ✅ A discount on your enrollment 🎁 6 bonus gifts, including job listings, interview prep, AI tools + more
If your goal is to land a data job in 2026, this is your chance to get ahead of the competition and start strong.
👉 Join the December Cohort & Claim Your Bonuses: https://DataCareerJumpstart.com/daa https://www.datacareerjumpstart.com/daa
Why design matters in data products is a question that, at first glance, may not be easily answered for some until they see users try to use ML models and analytics to make decisions. For Bill Báez, a data scientist and VP of Strategy at Ascend Innovations, realizing that design and UX matters in this context was a realization that grew over the course of a few years. Bill’s origins in the Air Force, and his transition to Ascend Innovations, instilled lessons about the importance of using design thinking with both clients and users.
After observing solutions built in total isolation with zero empathy and knowledge of how they were being perceived in the wild, Bill realized the critical need to bring developers “upstairs” to actually observe the people using the solutions that were being built.
Currently, Ascend Innovation’s consulting is primarily rooted in healthcare and community services, and in this episode, Bill provides some real-world examples where their machine learning and analytics solutions were informed by approaching the problems from a human-centered design perspective. Bill also dives in to where he is on his journey to integrate his UX and data science teams at Ascend so they can create better value for their clients and their client’s constituents.
Highlights in this episode include:
What caused Bill to notice design for the first time and its importance in data products (03:12) Bridging the gap between data science, UX, and the client’s needs at Ascend (08:07) How to deal with the “presenting problem” and working with feedback (16:00) Bill’s advice for getting designers, UX, and clients on the same page based on his experience to date (23:56) How Bill provides unity for his UX and data science teams (32:40) The effects of UX in medicine (41:00)
Quotes from Today’s Episode “My journey into Design Thinking started in earnest when I started at Ascend, but I didn’t really have the terminology to use. For example, Design Thinking and UX were actually terms I was not personally aware of until last summer. But now that I know and have been exposed to it and have learned more about it, I realize I’ve been doing a lot of that type of work in earnest since 2018. - Bill (03:37)
“Ascend Innovations has always been product-focused, although again, services is our main line of business. As we started hiring a more dedicated UX team, people who’ve been doing this for their whole career, it really helped me to understand what I had experienced prior to coming to Ascend. Part of the time I was here at Ascend that UX framework and that Design Thinking lens, it really brings a lot more firepower to what data science is trying to achieve at the end of the day.” - Bill (08:29) “Clients were surprised that we were asking such rudimentary questions. They’ll say ‘Well, we’ve already talked about that,’ or, ‘It should be obvious.’ or ‘Well, why are you asking me such a simple question?’ And we had to explain to them that we wanted to start at the bottom to move to the top. We don’t want to start somewhere midway and get the top. We want to make sure that we are all in alignment with what we’re trying to do, so we want to establish that baseline of understanding. So, we’re going to start off asking very simple questions and work our way up from there...” - Bill (21:09)
“We’re building a thing, but the thing only has value if it creates a change in the world. The world being, in the mind of the stakeholder, in the minds of the users, maybe some third parties that are affected by that stuff, but it’s the change that matters. So what is the better state we want in the future for our client or for our customers and users? That’s the thing we’re trying to create. Not the thing; the change from the thing is what we want, and getting to that is the hard part.” - Brian (@rhythmspice) (26:33)
“This is a gift that you’re giving to [stakeholders] to save time, to save money, to avoid building something that will never get used and will not provide value to them. You do need to push back against this and if they say no, that’s fine. Paint the picture of the risk, though, by not doing design. It’s very easy for us to build a ML model. It’s hard for us to build a model that someone will actually use to make the world better. And in this case, it’s healthcare or support, intervention support for addicts. “Do you really want a model, or do you want an improvement in the lives of these addicts? That’s ultimately where we’re going with this, and if we don’t do this, the risk of us pushing out an output that doesn’t get used is high. So, design is a gift, not a tax...” - Brian (@rhythmspice) (34:34)
“I’d say to anybody out there right now who’s currently working on data science efforts: the sooner you get your people comfortable with the idea of doing Design Thinking, get them implemented into the projects that are currently going on. [...] I think that will be a real game-changer for your data scientists and your organization as a whole...” - Bill (42:19)
by
Avery Smith
In this episode, I’ll explain what THE best project you can do for data science and how you can accomplish it.
I’ll give you my 5 step recipe for making a great data science project so you can find a data analytics job.
If you need to find datasets, check out Kaggle.com and Google Dataset Search Engine
Want to build more projects for your portfolio? Check out my course, Data Career Jumpstart: https://www.datacareerjumpstart.com/data-career-jumpstart-course
✅ If you liked this video, please rate and review the podcast to help against the war against the algorithm
If you want a free way to kickstart your analytics career, check out my free 33-page PDF giving you an introduction to everything you need to know: https://www.datacareerjumpstart.com/roadmap
If you’re just starting out, you can check out my 21 Day To Data Challenge: https://www.datacareerjumpstart.com/challenge
MORE DATA ANALYTICS CONTENT HERE:
📺 Subscribe YouTube: https://www.youtube.com/c/AverySmithDataCareerJumpstart/videos
🎙Listen to My Podcast: https://podcasts.apple.com/us/podcast/data-career-podcast/id1547386535
👔 Connect with me on LinkedIn: https://www.linkedin.com/in/averyjsmith/
📸 Instagram: https://www.instagram.com/datacareerjumpstart/
👾Join My Discord: https://www.datacareerjumpstart.com/discord
🎵 TikTok: https://www.tiktok.com/@verydata?
Mentioned in this episode: Join the last cohort of 2025! The LAST cohort of The Data Analytics Accelerator for 2025 kicks off on Monday, December 8th and enrollment is officially open!
To celebrate the end of the year, we’re running a special End-of-Year Sale, where you’ll get: ✅ A discount on your enrollment 🎁 6 bonus gifts, including job listings, interview prep, AI tools + more
If your goal is to land a data job in 2026, this is your chance to get ahead of the competition and start strong.
👉 Join the December Cohort & Claim Your Bonuses: https://DataCareerJumpstart.com/daa https://www.datacareerjumpstart.com/daa
When we talk about analytics and AI-driven organisations, we often think of the likes of Google, Amazon, Facebook, Netflix and Tencent, which have all risen to dominance during the internet era. But what about companies that have been around for much longer, can they achieve the same results with their data? To answer this question, I recently spoke to Tom Davenport who is one of the world’s foremost thought leaders and authors in the areas of business, analytics, data science and AI. He is the President’s Distinguished Professor of Information Technology and Management at Babson College, a Fellow of the MIT Center for Digital Business, and an independent senior advisor to Deloitte Analytics. He has authored more than 20 books and hundreds of articles on topics such as artificial intelligence, analytics, information and knowledge management, process management, and enterprise systems. He is a regular contributor to Harvard Business Review, Forbes Magazine, The Wall Street Journal and many other publications around the world. In this episode, Tom gives us a history lesson of data and analytics and provides an in-depth description of what it takes for traditional companies to ascend through what he calls the “Four Eras of Analytics”.
by
Avery Smith
In this episode, I explain the importance of having data before starting a machine learning project by sharing a story of freelancing in data science
LAST DAY TO JOIN 21 DAYS TO DATA: https://www.datacareerjumpstart.com/challenge
If you want a free way to kickstart your analytics career, check out my free 33-page PDF giving you an introduction to everything you need to know: https://www.datacareerjumpstart.com/roadmap
Want to learn data science while building your portfolio? Check out Data Career Jumpstart: https://www.datacareerjumpstart.com/data-career-jumpstart-course
MORE DATA ANALYTICS CONTENT HERE:
📺 Subscribe YouTube: https://www.youtube.com/c/AverySmithDataCareerJumpstart/videos
🎙Listen to My Podcast: https://podcasts.apple.com/us/podcast/data-career-podcast/id1547386535
👔 Connect with me on LinkedIn: https://www.linkedin.com/in/averyjsmith/
📸 Instagram: https://www.instagram.com/datacareerjumpstart/
👾Join My Discord: https://www.datacareerjumpstart.com/discord
🎵 TikTok: https://www.tiktok.com/@verydata?
Mentioned in this episode: Join the last cohort of 2025! The LAST cohort of The Data Analytics Accelerator for 2025 kicks off on Monday, December 8th and enrollment is officially open!
To celebrate the end of the year, we’re running a special End-of-Year Sale, where you’ll get: ✅ A discount on your enrollment 🎁 6 bonus gifts, including job listings, interview prep, AI tools + more
If your goal is to land a data job in 2026, this is your chance to get ahead of the competition and start strong.
👉 Join the December Cohort & Claim Your Bonuses: https://DataCareerJumpstart.com/daa https://www.datacareerjumpstart.com/daa
When most people hear digital transformation, it’s almost always the technology that first springs to mind.
That’s a mistake.
You can have the most sophisticated tech stack in the world, but if you don't build your organization’s data culture, your digital transformation efforts will be for naught.
Today’s guest, Mai AlOwaish, Chief Data Officer at Gulf Bank, knows this better than anyone. As the first female CDO in Kuwait, she’s on a mission to ensure everyone at Gulf Bank becomes an expert in the data they use every day.
Join us as we discuss:
Why data and people are more important than technology for digital transformationThe pioneering Data Ambassador program Mai spearheaded at Gulf BankThe importance of diversity in data science and technology overall
Find every episode of DataFramed on Apple, Spotify, and more. Find us on our website and join the conversation on LinkedIn. Listening on a desktop and can’t see the links? Just search for DataFramed in your favorite podcast player.
Why is the Data Scientist role called the sexiest job of the 21st century? I believe it’s partly because the data science profession is constantly evolving to include new data types, new tech and tools, new modelling techniques along with an increasing ability to drive customer and business outcomes with data. The main challenge for data scientists becomes one of bandwidth. Great data scientists are highly intelligent, technically proficient, curious and creative, but even so, the world of data science is evolving too fast for most individuals to keep up with. I recently spoke with Ravit Jain to understand how data professionals stay relevant and connected to the fast-paced world of data. Ravit is a true servant leader who has built a global online community of data lovers. Through his work as a book publisher, podcast and vlog host, content curator and conference organiser he helps hundreds of thousands of data professionals learn new skills, share knowledge and connect with each other. In this episode of Leaders of Analytics, we discuss what’s hot in data, including: How Ravit became passionate about the world of dataHow to build your career in dataThe most important trends and topics in data today and the futureThe traits that make some data science leaders stand out from the restWhy Ravit’s first advice for aspiring data professionals is to start networking with others in the industry, and much more.