In this episode of Data Skeptic, we explore the fascinating intersection of recommender systems and digital humanities with guest Florian Atzenhofer-Baumgartner, a PhD student at Graz University of Technology. Florian is working on Monasterium.net, Europe's largest online collection of historical charters, containing millions of medieval and early modern documents from across the continent. The conversation delves into why traditional recommender systems fall short in the digital humanities space, where users range from expert historians and genealogists to art historians and linguists, each with unique research needs and information-seeking behaviors. Florian explains the technical challenges of building a recommender system for cultural heritage materials, including dealing with sparse user-item interaction matrices, the cold start problem, and the need for multi-modal similarity approaches that can handle text, images, metadata, and historical context. The platform leverages various embedding techniques and gives users control over weighting different modalities—whether they're searching based on text similarity, visual imagery, or diplomatic features like issuers and receivers. A key insight from Florian's research is the importance of balancing serendipity with utility, collection representation to prevent bias, and system explainability while maintaining effectiveness. The discussion also touches on unique evaluation challenges in non-commercial recommendation contexts, including Florian's "research funnel" framework that considers discovery, interaction, integration, and impact stages. Looking ahead, Florian envisions recommendation systems becoming standard tools for exploration across digital archives and cultural heritage repositories throughout Europe, potentially transforming how researchers discover and engage with historical materials. The new version of Monasterium.net, set to launch with enhanced semantic search and recommendation features, represents an important step toward making cultural heritage more accessible and discoverable for everyone.
 talk-data.com
Topic
Funnel
19
tagged
Activity Trend
Top Events
This session offers a strategic vision for marketing by 2027, helping businesses prepare effective strategies for 2026. It highlights key technological shifts marketers must understand to stay competitive.
Seven major trends are covered: social platforms evolving into entertainment hubs; browsers transforming into AI concierges; AI dominating the middle funnel, requiring brands to own both ends; B2C marketing adopting B2B tactics to appeal to humans and AI; blockchain resurging for luxury verification; the rise of 'Voice-to-Vision' interfaces; and gaming becoming central to AI-driven emotional connections.
To address these shifts, proposed strategies include: shifting social content toward entertainment and using AI for creation; optimizing for AI discoverability through Agent Experience Optimization (AEO); launching brand campaigns designed for AI recognition; targeting both human and AI audiences; leveraging blockchain for exclusive offers; preparing for voice-input/image-output user journeys; and treating gaming as a core marketing channel.
Attendees will gain actionable insights to adapt their strategies, optimize for AI-first interactions, and leverage emerging technologies to thrive in the evolving marketing landscape.
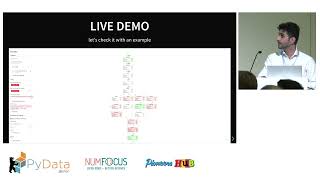
Optimizing user funnels is a common task for data analysts and data scientists. Funnels are not always linear in the real world. often, the next step depends on earlier responses or actions. This results in complex funnels that can be tricky to analyze. I’ll introduce an open-source Python library I developed that analyzes and visualizes non-linear, conditional funnels by utilizing Graphviz and Streamlit. It calculates conversion rates, drop-offs, time spent on each step, and highlights bottlenecks by color. Attendees will learn about how to quickly explore complex user journeys and generate insightful funnel data.
The City of Pittsburgh utilizes Airflow (via Astronomer) for a wide variety of tasks. From employee-focused use cases, like time bank balancing and internal dashboards, to public-facing publication, the City’s data flows through our DAGs from many sources to many sources. Airflow acts as a funnel point and is an essential tool for Pittsburgh’s Data Services team.
In this talk, Russell will explore the realities of customer journeys, challenge common misconceptions about customer behaviour, and highlight the role of attribution and lifetime value in identifying the key factors that drive performance, all with a fresh perspective on journey and funnel design.
🌟 Session Overview 🌟
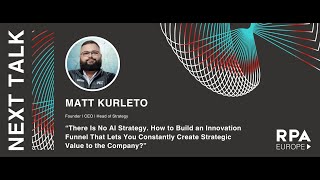
Session Name: here Is No AI Strategy. How to Build an Innovation Funnel That Lets You Constantly Create Strategic Value to the Company? Speaker: Matt Kurleto Session Description: 49% of Gartner’s respondents said they struggle with proving the value that Generative AI brings to their company. They also face challenges in governing AI implementations, managing risks, and controlling total cost of ownership (TCO).
This presentation will cover the controversial hypothesis that there is no such thing as an AI strategy – but AI should be approached strategically. It will begin with the concept of human-AI interaction and the perspective needed to effectively create and prioritize use cases for AI implementations.
The presentation will argue that the role of an AI strategy is not to develop AI products but to create an environment where the company can continuously innovate with AI.
It will propose a proven framework to define, measure, prioritize, and govern AI implementations, leveraging internal resources, external agencies, and an open innovation ecosystem.
🚀 About Big Data and RPA 2024 🚀
Unlock the future of innovation and automation at Big Data & RPA Conference Europe 2024! 🌟 This unique event brings together the brightest minds in big data, machine learning, AI, and robotic process automation to explore cutting-edge solutions and trends shaping the tech landscape. Perfect for data engineers, analysts, RPA developers, and business leaders, the conference offers dual insights into the power of data-driven strategies and intelligent automation. 🚀 Gain practical knowledge on topics like hyperautomation, AI integration, advanced analytics, and workflow optimization while networking with global experts. Don’t miss this exclusive opportunity to expand your expertise and revolutionize your processes—all from the comfort of your home! 📊🤖✨
📅 Yearly Conferences: Curious about the evolution of QA? Check out our archive of past Big Data & RPA sessions. Watch the strategies and technologies evolve in our videos! 🚀 🔗 Find Other Years' Videos: 2023 Big Data Conference Europe https://www.youtube.com/playlist?list=PLqYhGsQ9iSEpb_oyAsg67PhpbrkCC59_g 2022 Big Data Conference Europe Online https://www.youtube.com/playlist?list=PLqYhGsQ9iSEryAOjmvdiaXTfjCg5j3HhT 2021 Big Data Conference Europe Online https://www.youtube.com/playlist?list=PLqYhGsQ9iSEqHwbQoWEXEJALFLKVDRXiP
💡 Stay Connected & Updated 💡
Don’t miss out on any updates or upcoming event information from Big Data & RPA Conference Europe. Follow us on our social media channels and visit our website to stay in the loop!
🌐 Website: https://bigdataconference.eu/, https://rpaconference.eu/ 👤 Facebook: https://www.facebook.com/bigdataconf, https://www.facebook.com/rpaeurope/ 🐦 Twitter: @BigDataConfEU, @europe_rpa 🔗 LinkedIn: https://www.linkedin.com/company/73234449/admin/dashboard/, https://www.linkedin.com/company/75464753/admin/dashboard/ 🎥 YouTube: http://www.youtube.com/@DATAMINERLT
A practical introduction to data engineering on the powerful Snowflake cloud data platform. Data engineers create the pipelines that ingest raw data, transform it, and funnel it to the analysts and professionals who need it. The Snowflake cloud data platform provides a suite of productivity-focused tools and features that simplify building and maintaining data pipelines. In Snowflake Data Engineering, Snowflake Data Superhero Maja Ferle shows you how to get started. In Snowflake Data Engineering you will learn how to: Ingest data into Snowflake from both cloud and local file systems Transform data using functions, stored procedures, and SQL Orchestrate data pipelines with streams and tasks, and monitor their execution Use Snowpark to run Python code in your pipelines Deploy Snowflake objects and code using continuous integration principles Optimize performance and costs when ingesting data into Snowflake Snowflake Data Engineering reveals how Snowflake makes it easy to work with unstructured data, set up continuous ingestion with Snowpipe, and keep your data safe and secure with best-in-class data governance features. Along the way, you’ll practice the most important data engineering tasks as you work through relevant hands-on examples. Throughout, author Maja Ferle shares design tips drawn from her years of experience to ensure your pipeline follows the best practices of software engineering, security, and data governance. About the Technology Pipelines that ingest and transform raw data are the lifeblood of business analytics, and data engineers rely on Snowflake to help them deliver those pipelines efficiently. Snowflake is a full-service cloud-based platform that handles everything from near-infinite storage, fast elastic compute services, inbuilt AI/ML capabilities like vector search, text-to-SQL, code generation, and more. This book gives you what you need to create effective data pipelines on the Snowflake platform. About the Book Snowflake Data Engineering guides you skill-by-skill through accomplishing on-the-job data engineering tasks using Snowflake. You’ll start by building your first simple pipeline and then expand it by adding increasingly powerful features, including data governance and security, adding CI/CD into your pipelines, and even augmenting data with generative AI. You’ll be amazed how far you can go in just a few short chapters! What's Inside Ingest data from the cloud, APIs, or Snowflake Marketplace Orchestrate data pipelines with streams and tasks Optimize performance and cost About the Reader For software developers and data analysts. Readers should know the basics of SQL and the Cloud. About the Author Maja Ferle is a Snowflake Subject Matter Expert and a Snowflake Data Superhero who holds the SnowPro Advanced Data Engineer and the SnowPro Advanced Data Analyst certifications. Quotes An incredible guide for going from zero to production with Snowflake. - Doyle Turner, Microsoft A must-have if you’re looking to excel in the field of data engineering. - Isabella Renzetti, Data Analytics Consultant & Trainer Masterful! Unlocks the true potential of Snowflake for modern data engineers. - Shankar Narayanan, Microsoft Valuable insights will enhance your data engineering skills and lead to cost-effective solutions. A must read! - Frédéric L’Anglais, Maxa Comprehensive, up-to-date and packed with real-life code examples. - Albert Nogués, Danone
Misha Panko has worked in data for a long time, including on high performance data teams at Uber and Google. Today, Misha is the co-founder and CEO of Motif Analytics, a product focused on helping growth and ops teams understand their event data. In this episode, Tristan and Misha nerd out about the state of the art in computational neuroscience, where Misha got his PhD. They then go deep into event stream data and how it differs from classical fact and dimension data, and why it needs different analytical tools. Make sure to check out the back half of the episode, where they dive into AI and how Motif is applying breakthroughs in language modeling to train foundation models of event sequences—check out his team's blog post on their work. For full show notes and to read 6+ years of back issues of the podcast's companion newsletter, head to https://roundup.getdbt.com. The Analytics Engineering Podcast is sponsored by dbt Labs.
Only 1 in 10 organizations are meaningfully adopting generative AI today. Why Most tech stacks run on a labyrinth of applications, making it hard to access data or seamlessly embed AI into a workflow. Join us to learn how Google Cloud's Integration Services help you connect any application, integrate AI capabilities, and automate complex tasks. Learn how Wayfair built reusable, scaled components in a high-visibility workflow using Google's Application Integration, which enabled consistency in service, configurability of workflows, visibility into leads, customers, tasks, assignments, and so on, and made system-wide measurement easy throughout the Wayfair business-to-business sales funnel.
Click the blue “Learn more” button above to tap into special offers designed to help you implement what you are learning at Google Cloud Next 25.
Today, we’re joined by Derek Rey, Investor + Founder & CEO at Demand Inc., a human-driven AI-enabled sales development team. We talk about:
The loss of knowledge of how to send good emailThe paradox of needing AI in order to be human at scaleWhat Sales Development Reps can do to be successful, particularly while working with AIThe role of email marketing in building top of funnel pipeline
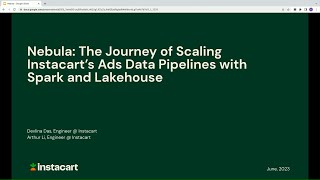
Instacart has gone through immense growth during the pandemic and the trend continues. Instacart ads is no exception in this growth story. We have launched many new product lines including display and video ads covering the full advertising funnel to address the increasing demand of our retail partners. We have built advanced models to auto-suggest optimal bidding to increase the ROI for our CPG partners. Advertisers’ trust is the utmost priority and thus the quest to build a top-class ads measurement platform.
Ads data processing requires complex data verifications to update ads serving stats. In ETL pipelines these were implemented through files containing thousands of lines of raw SQL which were hard to scale, test, and iterate upon. Our data engineers used to spend hours testing small changes due to a lack of local testing mechanisms. These pain points stress our need for better tools. After some research, we chose Apache Spark™ as our preferred tool to rebuild ETLs, and the Databricks platform made this move easier. In this session, We'll share our journey to move our pipelines to Spark and Delta Lake on Databricks. With Spark, Scala, and Delta we solved many problems which were slowing the team’s productivity. Some key areas that will be covered include:
- Modular and composable code
- Unit testing framework
- Incremental event processing with spark structured streaming
- Granular resource tuning for better performance and cost efficacy
Other than the domain business logic, the problems discussed here are quite common for performing data processing at scale. We hope that sharing our learnings will benefit others who are going through similar growth challenges or migrating to Lakehouse.
Talk by: Devlina Das and Arthur Li
Connect with us: Website: https://databricks.com Twitter: https://twitter.com/databricks LinkedIn: https://www.linkedin.com/company/databricks Instagram: https://www.instagram.com/databricksinc Facebook: https://www.facebook.com/databricksinc
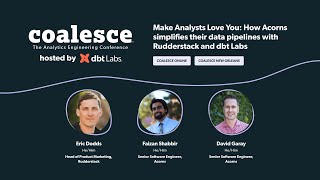
Understanding the user funnel and measuring conversion is critical to Acorns as a subscription business. The engineering team turned to Rudderstack to track customer interaction in near real-time across web, ios, and android. However, transforming that into actionable insights required carefully curated SQL spanning two datastores. Come learn how the data engineering team used dbt to build a centralized metrics interface and dynamic funnels in a data landscape spanning Rudderstack, Redshift, Databricks, and dbt with Tableau as our visualization tool.
Check the slides here: https://docs.google.com/presentation/d/1MTbqysGH_9oxUPKgQQO2MYM1f1XUhSVw_ERDvaZ8Qsg/edit?usp=sharing
Coalesce 2023 is coming! Register for free at https://coalesce.getdbt.com/.
In this talk, you'll learn how the team at TULA Skincare took a product perspective to the customer journey to understand how customers progress from. basic products to more advanced ones.
It's important to map out the customer journey to understand where they get stuck, where they need help, where the business can improve.
However, when folx talk about mapping a customer’s journey, it's typically only from a marketing perspective. Which channels brought a customer into the funnel? How did they end up converting?
This is important, but that only covers the beginning of the journey where they become a customer. What about the rest of the customer journey where they begin to use your product(s) then go on to buy from you again and again?
What does that customer journey look like?
In this video, Sanjana Sen and Grant Winship of Fishtown Analytics talk through how they approached this exercise while working with the TULA team.
Learn more about dbt at: https://getdbt.com https://twitter.com/getdbt
Learn more about Fishtown Analytics at: https://fishtownanalytics.com https://twitter.com/fishtowndata https://www.linkedin.com/company/fishtown-analytics/
For years, the advertising industry has relied on so called creative campaigns to boost GRPs and attribute marketing program effectiveness to end of funnel sales. Digital, and more specifically analytics, has brought about promises of transparency through numbers while remaining confined to the realm of measurability. Actors, battling for budgets, are all trying to technologically trace back and attribute the spark that made that very purchase happen, call it attribution or direct, last click, first click, what ever... conversion. After years of experience in the Digital sector, René has joined Neo@Ogilvy, Ogilvy & Mather’s global media agency and performance network where he’s building an Analytics team from scratch. René will share what he’s building, moving beyond traditional site centric Digital Analytics. His challenges encompass data integrations, bringing together CRM data to fuel campaigns, being able to measure the impact of the online channel in offline sales. It’s about helping clients transform the way they use technology and transform their business.
Companies face the challenge of measuring and analyzing the near-overwhelming quantities of data generated from their online businesses and then using that data to gain critical insights into their customersvto drive sales. Adobe Analytics (formerly SiteCatalyst) provides product and content managers, marketers, and analysts with real-time intelligence on customers’online behavior, helps businesses anticipate what their customers will want, personalizes their onlinev experience, and delivers relevant content across web and mobile channels. This quick lookup guide by Adobe Analytics expert Shane Closser uses clear, concise explanations and an easy-to-use format to jump in and start using Adobe’s powerful web analytics tool. You’ll learn the quickest way to: Create metrics Run and set options for reports Measure the effectiveness of marketing campaigns Engage and retain customers Track customers through the conversion funnel Share reports and set up dashboards
In digital marketing, your goal is to funnel your potential customers from the point of making them aware of your website, through engagement and conversion, and ultimately retaining them as loyal customers. Your strategies must be based on careful analysis so you know what is working for you at each stage. Adobe Analytics with SiteCatalyst Classroom in a Book teaches effective techniques for using Adobe SiteCatalyst to establish and measure key performance indicators (KPIs) tailored to your business and website. For each phase of marketing funnel analytics, author Vidya Subramanian walks you through multiple reports, showing you how to interpret the data and highlighting implementation details that affect data quality. With this essential guide, you’ll learn to optimize your web analytics results with SiteCatalyst. Adobe Analytics with SiteCatalyst Classroom in a Book contains 10 lessons. The book covers the basics of learning Adobe SiteCatalyst and provides countless tips and techniques to help you become more productive with the program. You can follow the book from start to finish or choose only those lessons that interest you. Classroom in a Book®, the best-selling series of hands-on software training workbooks, helps you learn the features of Adobe software quickly and easily. Classroom in a Book offers what no other book or training program does—an official training series from Adobe Systems Incorporated, developed with the support of Adobe product experts. ..
Get the latest information about using the #1 web analytics tool from this fully updated guide Google Analytics is the free tool used by millions of web site owners to assess the effectiveness of their efforts. Its revised interface and new features will offer even more ways to increase the value of your web site, and this book will teach you how to use each one to best advantage. Featuring new content based on reader and client requests, the book helps you implement new methods and concepts, track social and mobile visitors, use the new multichannel funnel reporting features, understand which filters to use, and much more. Gets you up and running with all the new tools in the revamped Google Analytics, and includes content requested by readers and users especially for new GA users Covers social media analytics features, advanced segmentation displays, multi-dashboard configurations, and using Top 20 reports Provides a detailed best-practices implementation guide covering advanced topics, such as how to set up GA to track dynamic web pages, banners, outgoing links, and contact forms Includes case studies and demonstrates how to optimize pay-per-click accounts, integrate AdSense, work with new reports and reporting tools, use ad version testing, and more Make your web site a more effective business tool with the detailed information and advice about Google Analytics in Advanced Web Metrics with Google Analytics, 3nd Edition.
Master the Combined Analysis Tools in Oracle CRM on Demand Drive better decision-making across your enterprise using the reporting and analysis techniques in this Oracle Press guide. Through clear explanations and detailed case studies, Oracle CRM on Demand Combined Analyses shows you how to deliver real-time insightful business intelligence to end users. Learn how to perform multiple queries, join tables, format result columns, and add interactivity to your reports. Methods for filtering the results of a combined analysis are also covered in this practical resource. Create, edit, and join reports with set operators in Oracle Answers On Demand Configure roles and privileges to allow access to development tools Use negative reporting methods to compensate for null data Analyze records from the transactional databases and data warehouse in federated reports Add advanced views such as gauges, view selectors, funnel charts, and narrative views to your combined reports Integrate ad hoc analysis using Oracle Answers on Demand Consolidate information from disparate sources with pivot tables Perform calculations across multiple reports using result columns