talk-data.com talk-data.com

Topic

Tableau

data_visualization bi analytics

162

tagged

Activity Trend

11 peak/qtr
2020-Q1 2026-Q1

Activities

162 activities · Newest first

Why self-serve analytics & AI fail -- and how metadata can save them

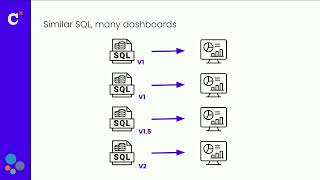
Self-serve analytics promises speed. But without clear guidance, it often leads to hidden obstacles like cluttered dashboards, runaway costs, and a loss of trust in the data. Add AI to the mix, and those faults become fractures. In this session, we'll unpack why self-serve efforts stall, with lessons from real-world teams at Shopify and Tableau. We’ll also explore how BetterHelp uses dbt alongside Euno’s lineage and usage insights to declutter, cut compute costs, and determine which data assets and reports teams (and AI agents) can trust.

Dans un contexte où les entreprises doivent faire plus avec moins, la combinaison de Denodo et Snowflake s’impose comme une solution puissante pour accélérer la mise à disposition des données, tout en garantissant productivité et gouvernance, même avec des équipes réduites.

Cet atelier vous propose de découvrir comment CENTRE FRANCE a mis en place un dataware virtuel capable d’agréger des données issues de multiples sources — qu’elles soient conservées dans les systèmes d’origine ou déposées dans Snowflake — et de les rendre accessibles en temps réel via des outils comme Tableau.

Ce que vous allez découvrir :

- Un gain de temps significatif sur la préparation des données grâce à la virtualisation

- Un suivi opérationnel en temps réel 

- Un Data Catalog orienté métier permettant l’exploration, qualification, autonomie des utilisateurs

- Une gouvernance renforcée : sécurité, traçabilité

- Des vues multi-sources pour répondre aux besoins marketing (segmentation, ciblage…)

- Une intégration prévue avec les outils de mailing pour des campagnes personnalisées

- Une plateforme évolutive : support des développements spécifiques selon les besoins

When Virgin Media and O2 merged, they faced the challenge of unifying thousands of pipelines and platforms while keeping 25 million customers connected. Victor Rivero, Head of Data Governance & Quality, shares how his team is transforming his data estate into a trusted source of truth by embedding Monte Carlo’s Data + AI Observability across BigQuery, Atlan, dbt, and Tableau. Learn how they've begun their journey to cut data downtime, enforced reliability dimensions, and measured success while creating a scalable blueprint for enterprise observability.

In this episode, I sit down with Wendy Turner-Williams, a distinguished tech leader and executive with a deep history at companies like Microsoft and Salesforce. She's of the original minds behind what became Azure Data Factory, among other foundational tech. In this wide-ranging conversation, Wendy charts the trajectory from the early days of the Internet to the current AI-driven hype cycle and looming crisis. She explains how these tools of innovation are now being turned against the workforce and why this technological revolution is fundamentally more disruptive than anything that has come before. This episode is a candid, unfiltered discussion about the real-world impact of AI on jobs, the economy, and our collective future, and a call for leaders to act before it's too late. Timestamps: 00:22 - Catching up: The tough job market and writing new books. 05:49 - Wendy's impressive career history at Microsoft, Salesforce, and Tableau. 06:17 - The origin story of Azure Data Factory and other foundational projects at Microsoft. 09:18 - A personal story about the challenges of being a woman in Big Tech in the early days. 13:02 - A look back at a favorite early-career project: Digitizing physical maps with nascent GPS technology in 2001. 18:11 - The state of the tech industry: "Tech is cannibalizing itself because of AI." 20:31 - The massive, impending shock to the job market and why AI is different from previous industrial revolutions. 27:26 - Why the "human in the loop" is a temporary and misleading solution. 29:55 - Breaking down the numbers: The staggering quantity of white-collar jobs projected to be eliminated. 36:37 - Why leaders are failing to act and conversations are happening behind closed doors without solutions. 38:25 - Discussing potential solutions: Should companies have quotas for their human workforce? 45:21 - The need for "truth tellers" and leaders who are willing to question the current path and drive human-centric transformation. 53:15 - The grim reality for recent graduates with computer science degrees who can't find jobs. 56:22 - The risk of IP hoarding and engineers deliberately crippling systems to protect their jobs. 01:00:20 - Final thoughts: Are we waiting for a "let them eat cake" moment before we see real change?

Here are 5 exciting and unique data analyst projects that will build your skills and impress hiring managers! These range from beginner to advanced and are designed to enhance your data storytelling abilities. ✨ Try Julius today at https://landadatajob.com/Julius-YT Where I Go To Find Datasets (as a data analyst) 👉 https://youtu.be/DHfuvMyBofE?si=ABsdUfzgG7Nsbl89 💌 Join 10k+ aspiring data analysts & get my tips in your inbox weekly 👉 https://www.datacareerjumpstart.com/newsletter 🆘 Feeling stuck in your data journey? Come to my next free "How to Land Your First Data Job" training 👉 https://www.datacareerjumpstart.com/training 👩‍💻 Want to land a data job in less than 90 days? 👉 https://www.datacareerjumpstart.com/daa 👔 Ace The Interview with Confidence 👉 https://www.datacareerjumpstart.com/interviewsimulator

⌚ TIMESTAMPS 00:00 - Introduction 00:24 - Project 1: Stock Price Analysis 03:46 - Project 2: Real Estate Data Analysis (SQL) 07:52 - Project 3: Personal Finance Dashboard (Tableau or Power BI) 11:20 - Project 4: Pokemon Analysis (Python) 14:16 - Project 5: Football Data Analysis (any tool)

🔗 CONNECT WITH AVERY 🎥 YouTube Channel: https://www.youtube.com/@averysmith 🤝 LinkedIn: https://www.linkedin.com/in/averyjsmith/ 📸 Instagram: https://instagram.com/datacareerjumpstart 🎵 TikTok: https://www.tiktok.com/@verydata 💻 Website: https://www.datacareerjumpstart.com/ Mentioned in this episode: Join the last cohort of 2025! The LAST cohort of The Data Analytics Accelerator for 2025 kicks off on Monday, December 8th and enrollment is officially open!

To celebrate the end of the year, we’re running a special End-of-Year Sale, where you’ll get: ✅ A discount on your enrollment 🎁 6 bonus gifts, including job listings, interview prep, AI tools + more

If your goal is to land a data job in 2026, this is your chance to get ahead of the competition and start strong.

👉 Join the December Cohort & Claim Your Bonuses: https://DataCareerJumpstart.com/daa https://www.datacareerjumpstart.com/daa

Feeling behind on your data journey? Don't worry. Today, I'll list down the 13 signs that prove you're actually ahead (even if you're actually doing just some of these). ✨ Try Julius today at https://landadatajob.com/Julius-YT 💌 Join 10k+ aspiring data analysts & get my tips in your inbox weekly 👉 https://www.datacareerjumpstart.com/newsletter 🆘 Feeling stuck in your data journey? Come to my next free "How to Land Your First Data Job" training 👉 https://www.datacareerjumpstart.com/training 👩‍💻 Want to land a data job in less than 90 days? 👉 https://www.datacareerjumpstart.com/daa 👔 Ace The Interview with Confidence 👉 https://www.datacareerjumpstart.com/interviewsimulator ⌚ TIMESTAMPS 00:00 Introduction 00:05 #1 You can analyze data in Excel without panicking 00:52 #2 You know how to write basic SQL queries 01:17 #3 You can build a bar chart and scatter plot in Tableau or Power BI 01:59 #4 You can Google (or ChatGPT) your way through any error 02:45 #5 You can send me one portfolio project right now 03:45 #6 You talk about your data journey with friends and family regularly 05:50 #7 You’re actually applying to jobs (not just watching tutorials) 07:03 #8 You’ve joined a data community 07:48 #9 Your resume now includes (lots of) the right keywords 10:11 #10 You’ve optimized your LinkedIn for data roles 10:45 #11 A recruiter reaches out to you on LinkedIn 11:58 #12 You’ve had at least one real interview 12:52 #13 You’re comfortable not knowing everything (yet) 🔗 CONNECT WITH AVERY 🎥 YouTube Channel: https://www.youtube.com/@averysmith 🤝 LinkedIn: https://www.linkedin.com/in/averyjsmith/ 📸 Instagram: https://instagram.com/datacareerjumpstart 🎵 TikTok: https://www.tiktok.com/@verydata 💻 Website: https://www.datacareerjumpstart.com/ Mentioned in this episode: Join the last cohort of 2025! The LAST cohort of The Data Analytics Accelerator for 2025 kicks off on Monday, December 8th and enrollment is officially open!

To celebrate the end of the year, we’re running a special End-of-Year Sale, where you’ll get: ✅ A discount on your enrollment 🎁 6 bonus gifts, including job listings, interview prep, AI tools + more

If your goal is to land a data job in 2026, this is your chance to get ahead of the competition and start strong.

👉 Join the December Cohort & Claim Your Bonuses: https://DataCareerJumpstart.com/daa https://www.datacareerjumpstart.com/daa

Learning Tableau 2025 - Sixth Edition

"Learning Tableau 2025" provides a comprehensive guide to mastering Tableau's latest features, including advanced AI capabilities like Tableau Pulse and Agent. This book, authored by Tableau expert Joshua N. Milligan, will equip you with the tools to transform complex data into actionable insights and interactive dashboards. What this Book will help me do Learn to use Tableau's advanced AI features, including Tableau Agent and Pulse, to streamline data analysis and automate insights. Develop skills to create and customize dynamic dashboards tailored to interactive data storytelling. Understand and utilize new geospatial functions within Tableau for advanced mapping and analytics. Master Tableau Prep's enhanced data preparation capabilities for efficient data modeling and structuring. Learn to effectively integrate and analyze data from multiple sources, enhancing your ability to extract meaningful insights. Author(s) Joshua N. Milligan, a Tableau Zen Master and Visionary, has years of experience in the field of data visualization and analytics. With a hands-on approach, Joshua combines his expertise and passion for Tableau to make complex topics accessible and engaging. His teaching method ensures that readers gain practical, actionable knowledge. Who is it for? This book is ideal for aspiring business intelligence developers, data analysts, data scientists, and professionals seeking to enhance their data visualization skills. It's suitable for both beginners looking to get started with Tableau and experienced users eager to explore its new features. A Tableau license or access to a 14-day trial is recommended.

Jumpstart Snowflake: A Step-by-Step Guide to Modern Cloud Analytics

This book is your guide to the modern market of data analytics platforms and the benefits of using Snowflake, the data warehouse built for the cloud. As organizations increasingly rely on modern cloud data platforms, the core of any analytics framework—the data warehouse—is more important than ever. This updated 2nd edition ensures you are ready to make the most of the industry’s leading data warehouse. This book will onboard you to Snowflake and present best practices for deploying and using the Snowflake data warehouse. The book also covers modern analytics architecture, integration with leading analytics software such as Matillion ETL, Tableau, and Databricks, and migration scenarios for on-premises legacy data warehouses. This new edition includes expanded coverage of SnowPark for developing complex data applications, an introduction to managing large datasets with Apache Iceberg tables, and instructions for creating interactive data applications using Streamlit, ensuring readers are equipped with the latest advancements in Snowflake's capabilities. What You Will Learn Master key functionalities of Snowflake Set up security and access with cluster Bulk load data into Snowflake using the COPY command Migrate from a legacy data warehouse to Snowflake Integrate the Snowflake data platform with modern business intelligence (BI) and data integration tools Manage large datasets with Apache Iceberg Tables Implement continuous data loading with Snowpipe and Dynamic Tables Who This Book Is For Data professionals, business analysts, IT administrators, and existing or potential Snowflake users

In today’s fast-paced business world, timely and reliable insights are crucial — but manual BI workflows can’t keep up. This session offers a practical guide to automating business intelligence processes using Apache Airflow. We’ll walk through real-world examples of automating data extraction, transformation, dashboard refreshes, and report distribution. Learn how to design DAGs that align with business SLAs, trigger workflows based on events, integrate with popular BI tools like Tableau and Power BI, and implement alerting and failure recovery mechanisms. Whether you’re new to Airflow or looking to scale your BI operations, this session will equip you with actionable strategies to save time, reduce errors, and supercharge your organization’s decision-making capabilities.

Enter the agentic era of data and analytics with Tableau and Agentforce. Discover how AI agents are accelerating data modeling and unlocking conversational analytics. Hear how leading organizations are harnessing agents to reimagine decision-making, supercharge insight delivery, and unleash the full potential of their data-driven workforce.

The explosion of AI has helped make the enterprise data landscape more important, and complex, than ever before. Join us to learn how Databricks’ and Tableau’s platforms come together to empower users of all kinds to see, understand, and act on your data in a secure, governed, and performant way.

Geo-Powering Insights: The Art of Spatial Data Integration and Visualization

In this presentation, we will explore how to leverage Databricks' SQL engine to efficiently ingest and transform geospatial data. We'll demonstrate the seamless process of connecting to external systems such as ArcGIS to retrieve datasets, showcasing the platform's versatility in handling diverse data sources. We'll then delve into the power of Databricks Apps, illustrating how you can create custom geospatial dashboards using various frameworks like Streamlit and Flask, or any framework of your choice. This flexibility allows you to tailor your visualizations to your specific needs and preferences. Furthermore, we'll highlight the Databricks Lakehouse's integration capabilities with popular dashboarding tools such as Tableau and Power BI. This integration enables you to combine the robust data processing power of Databricks with the advanced visualization features of these specialized tools.

AI/BI Dashboards and AI/BI Genie: Dashboards and Last-Mile Analytics Made Simple

Databricks announced two new features in 2024: AI/BI Dashboards and AI/BI Genie. Dashboards is a redesigned dashboarding experience for your regular reporting needs, while Genie provides a natural language experience for your last-mile analytics. In this session, Databricks Solutions Architect and content creator Youssef Mrini will present alongside Databricks MVP and content creator Josue A. Bogran on how you can get the most value from these tools for your organization. Content covered includes: Setup necessary, including Unity Catalog, permissions and compute Building out a dashboard with AI/BI Dashboards Creating and training an AI/BI Genie workspace to reliably deliver answers When to use Dashboards, Genie, and when to use other tools such as PBI, Tableau, Sigma, ChatGPT, etc. Fluff-free, full of practical tips, and geared to help you deliver immediate impact with these new Databricks capabilities.

Accelerating Analytics: Integrating BI and Partner Tools to Databricks SQL

This session is repeated. Did you know that you can integrate with your favorite BI tools directly from Databricks SQL? You don’t even need to stand up an additional warehouse. This session shows the integrations with Microsoft Power Platform, Power BI, Tableau and dbt so you can have a seamless integration experience. Directly connect your Databricks workspace with Fabric and Power BI workspaces or Tableau to publish and sync data models, with defined primary and foreign keys, between the two platforms.

Explore how Salesforce Data Cloud and Tableau, powered by intelligent agents, are revolutionizing data-driven decision-making, enabling seamless analytics and faster insights. This session explores how unified customer 360, real-time analytics, and AI-driven insights empower organizations to act swiftly and innovate effectively.

As enterprises accelerate their digital transformation journeys, the convergence of AI, data, and analytics is reshaping decision-making at every level. CDOs and CIOs are at the forefront of this shift, balancing data strategy, governance, and AI-driven automation to drive competitive advantage.