From Tableau Conference 2024, watch this recording of one of the popular Hands-on Training Sessions. Learn how to navigate your Tableau Cloud site essentials: configure settings, manage permissions, explore admin capabilities, and publish.
Topic
162
tagged
From Tableau Conference 2024, watch this recording of one of the popular Hands-on Training Sessions. Learn how to navigate your Tableau Cloud site essentials: configure settings, manage permissions, explore admin capabilities, and publish.
From Tableau Conference 2024, watch one of the popular Hands-on Training Sessions.
Keep the Beat: Mix and Master with Tableau Pulse Tune in as we dive into a symphony of data with Tableau Pulse. Discover how to orchestrate datasets using AI, uncovering hidden melodies that make your data resonate more than ever before.
Doing sales better is perhaps the most direct route to making more revenue, so it should be a priority for every business. B2B sales is often very complex, with a mix of emails and video calls and prospects interacting with your website and social content. And you often have multiple people making decisions about a purchase. All this generates a massive data—or, more accurately, a mess of data—which very few sales teams manage to harness effectively. How can sales teams can make use of data, software, and AI to clean up this mess, work more effectively, and most of all, crush those quarterly targets? Ellie Fields is the Chief Product and Engineering Officer at Salesloft leading Product Management, Engineering, and Design. Ellie previously led development teams at Tableau responsible for product strategy and engineering for collaboration and mobile portfolio. Ellie also launched and led Tableau Public. In the episode Richie and Ellie explore the digital transformation of sales, how sales technology helps buyers and sellers, metrics for sales success, activity vs outcome metrics, predictive forecasting, AI, customizing sales processes, revenue orchestration, how data impacts sales and management, future trends in sales, and much more. Links Mentioned in the Show: SalesloftConnect with EllieForrester ResearchCourse - Understanding the EU AI ActRelated Episode: Data & AI at Tesco with Venkat Raghavan, Director of Analytics and Science at TescoRewatch sessions from RADAR: AI Edition New to DataCamp? Learn on the go using the DataCamp mobile app Empower your business with world-class data and AI skills with DataCamp for business
At Wix more often than not business analysts build workflows themselves to avoid data engineers being a bottleneck. But how do you enable them to create SQL ETLs starting when dependencies are ready and sending emails or refreshing Tableau reports when the work is done? One simple answer may be to use Airflow. The problem is every BA cannot be expected to know Python and Git so well that they will create thousands of DAGs easily. To bridge this gap we have built a web-based IDE, called Quix, that allows simple notebook-like development of Trino SQL workflows and converts them to Airflow DAGs when a user hits the “schedule” button. During the talk we will go through the problems of building a reliable and extendable DAG generating tool, why we preferred Airflow over Apache Oozie and also tricks (sharding, HA-mode, etc) allowing Airflow to run 8000 active DAGs on a single cluster in k8s.
Using various operators to perform daily routines. Integration with Technologies: Redis: Acts as a caching mechanism to optimize data retrieval and processing speed, enhancing overall pipeline performance. MySQL: Utilized for storing metadata and managing task state information within Airflow’s backend database. Tableau: Integrates with Airflow to generate interactive visualizations and dashboards, providing valuable insights into the processed data. Amazon Redshift: Panasonic leverages Redshift for scalable data warehousing, seamlessly integrating it with Airflow for data loading and analytics. Foundry: Integrated with Airflow to access and process data stored within Foundry’s data platform, ensuring data consistency and reliability. Plotly Dashboards: Employed for creating custom, interactive web-based dashboards to visualize and analyze data processed through Airflow pipelines. GitLab CI/CD Pipelines: Utilized for version control and continuous integration/continuous deployment (CI/CD) of Airflow DAGs (Directed Acyclic Graphs), ensuring efficient development and deployment of workflows.
The 'Tableau Certified Data Analyst Certification Guide' is your essential roadmap to mastering Tableau and excelling in the Tableau Data Analyst certification exam. From fundamentals to advanced techniques, you'll solidify your Tableau skills with clear explanations, practical exercises, and realistic mock exams. After reading, you'll be ready to take the next step in your data analytics career. What this Book will help me do Gain the ability to connect, clean, and transform data effectively using Tableau. Master Tableau's diverse calculation types for data analysis, ranging from basic to advanced. Develop skills to create visually impactful dashboards and data stories. Learn to publish and manage insights on Tableau Cloud for broader collaboration. Acquire the necessary competencies to confidently pass the Tableau Data Analyst certification exam. Author(s) Authors Harry Cooney and Daisy Jones bring a wealth of Tableau and data analytics experience. Harry is a certified Tableau expert with years of teaching and consulting, while Daisy applies her data analysis expertise across industries. Together, they combine practical insights and a supportive approach to guide you through Tableau mastery and certification. Who is it for? This book is ideal for aspiring and practicing data analysts eager to master Tableau. Beginners will appreciate the accessible approach to foundational concepts, while experienced users can deepen their expertise. If you're preparing for the Tableau Certified Data Analyst exam or looking to enhance your visual analytics capabilities, this book is for you.

Take your data viz to the next level as Tableau Ambassadors Heidi Kalbe and Tore Levinsen, and Tableau Visionary Annabelle Rincon share Tableau tips, tricks, and shortcuts for all skill levels.
Summary
Data lakehouse architectures have been gaining significant adoption. To accelerate adoption in the enterprise Microsoft has created the Fabric platform, based on their OneLake architecture. In this episode Dipti Borkar shares her experiences working on the product team at Fabric and explains the various use cases for the Fabric service.
Announcements
Hello and welcome to the Data Engineering Podcast, the show about modern data management Data lakes are notoriously complex. For data engineers who battle to build and scale high quality data workflows on the data lake, Starburst is an end-to-end data lakehouse platform built on Trino, the query engine Apache Iceberg was designed for, with complete support for all table formats including Apache Iceberg, Hive, and Delta Lake. Trusted by teams of all sizes, including Comcast and Doordash. Want to see Starburst in action? Go to dataengineeringpodcast.com/starburst and get $500 in credits to try Starburst Galaxy today, the easiest and fastest way to get started using Trino. Your host is Tobias Macey and today I'm interviewing Dipti Borkar about her work on Microsoft Fabric and performing analytics on data withou
Interview
Introduction How did you get involved in the area of data management? Can you describe what Microsoft Fabric is and the story behind it? Data lakes in various forms have been gaining significant popularity as a unified interface to an organization's analytics. What are the motivating factors that you see for that trend? Microsoft has been investing heavily in open source in recent years, and the Fabric platform relies on several open components. What are the benefits of layering on top of existing technologies rather than building a fully custom solution?
What are the elements of Fabric that were engineered specifically for the service? What are the most interesting/complicated integration challenges?
How has your prior experience with Ahana and Presto informed your current work at Microsoft? AI plays a substantial role in the product. What are the benefits of embedding Copilot into the data engine?
What are the challenges in terms of safety and reliability?
What are the most interesting, innovative, or unexpected ways that you have seen the Fabric platform used? What are the most interesting, unexpected, or challenging lessons that you have learned while working on data lakes generally, and Fabric specifically? When is Fabric the wrong choice? What do you have planned for the future of data lake analytics?
Contact Info
Parting Question
From your perspective, what is the biggest gap in the tooling or technology for data management today?
Closing Announcements
Thank you for listening! Don't forget to check out our other shows. Podcast.init covers the Python language, its community, and the innovative ways it is being used. The Machine Learning Podcast helps you go from idea to production with machine learning. Visit the site to subscribe to the show, sign up for the mailing list, and read the show notes. If you've learned something or tried out a project from the show then tell us about it! Email [email protected] with your story.
Links
Microsoft Fabric Ahana episode DB2 Distributed Spark Presto Azure Data MAD Landscape
Podcast Episode ML Podcast Episode
Tableau dbt Medallion Architecture Microsoft Onelake ORC Parquet Avro Delta Lake Iceberg
Podcast Episode
Hudi
Podcast Episode
Hadoop PowerBI
Podcast Episode
Velox Gluten Apache XTable GraphQL Formula 1 McLaren
The intro and outro music is from The Hug by The Freak Fandango Orchestra / CC BY-SA
Sponsored By:
Starburst: 
This episode is brought to you by Starburst - an end-to-end data lakehouse platform for data engineers who are battling to build and scale high quality data pipelines on the data lake. Powered by T

Speaker: Matei Zaharia, Original Creator of Apache Spark™ and MLflow; Chief Technologist, Databricks
Summary: Data sharing and collaboration are important aspects of the data space. Matei Zaharia explains the evolution of the Databricks data platform to facilitate data sharing and collaboration for customers and their partners.
Delta Sharing allows you to share parts of your table with third parties authorized to view them. Over 16,000 data recipients use Delta Sharing, and 40% are not on Databricks—a testament to the open nature.
Databricks Marketplace has been growing rapidly and now has over 2,000 data listings, making it one of the largest data marketplaces available. New Marketplace partners include T-Mobile, Tableau, Atlassian, Epsilon, Shutterstock and more.
To learn more about Delta Sharing features and the expansion of partner sharing ecosystem, see the recent blog: https://www.databricks.com/blog/whats-new-data-sharing-and-collaboration

Reynold Xin, Co-founder and Chief Architect at Databricks, presented during Data + AI Summit 2024 on Databricks SQL and its advancements and how to drive performance improvements with the Databricks Data Intelligence Platform.
Speakers: Reynold Xin, Co-founder and Chief Architect, Databricks Pearl Ubaru, Technical Product Engineer, Databricks
Main Points and Key Takeaways (AI-generated summary)
Introduction of Databricks SQL: - Databricks SQL was announced four years ago and has become the fastest-growing product in Databricks history. - Over 7,000 customers, including Shell, AT&T, and Adobe, use Databricks SQL for data warehousing.
Evolution from Data Warehouses to Lakehouses: - Traditional data architectures involved separate data warehouses (for business intelligence) and data lakes (for machine learning and AI). - The lakehouse concept combines the best aspects of data warehouses and data lakes into a single package, addressing issues of governance, storage formats, and data silos.
Technological Foundations: - To support the lakehouse, Databricks developed Delta Lake (storage layer) and Unity Catalog (governance layer). - Over time, lakehouses have been recognized as the future of data architecture.
Core Data Warehousing Capabilities: - Databricks SQL has evolved to support essential data warehousing functionalities like full SQL support, materialized views, and role-based access control. - Integration with major BI tools like Tableau, Power BI, and Looker is available out-of-the-box, reducing migration costs.
Price Performance: - Databricks SQL offers significant improvements in price performance, which is crucial given the high costs associated with data warehouses. - Databricks SQL scales more efficiently compared to traditional data warehouses, which struggle with larger data sets.
Incorporation of AI Systems: - Databricks has integrated AI systems at every layer of their engine, improving performance significantly. - AI systems automate data clustering, query optimization, and predictive indexing, enhancing efficiency and speed.
Benchmarks and Performance Improvements: - Databricks SQL has seen dramatic improvements, with some benchmarks showing a 60% increase in speed compared to 2022. - Real-world benchmarks indicate that Databricks SQL can handle high concurrency loads with consistent low latency.
User Experience Enhancements: - Significant efforts have been made to improve the user experience, making Databricks SQL more accessible to analysts and business users, not just data scientists and engineers. - New features include visual data lineage, simplified error messages, and AI-driven recommendations for error fixes.
AI and SQL Integration: - Databricks SQL now supports AI functions and vector searches, allowing users to perform advanced analysis and query optimizations with ease. - The platform enables seamless integration with AI models, which can be published and accessed through the Unity Catalog.
Conclusion: - Databricks SQL has transformed into a comprehensive data warehousing solution that is powerful, cost-effective, and user-friendly. - The lakehouse approach is presented as a superior alternative to traditional data warehouses, offering better performance and lower costs.
Want to streamline your workflow in Tableau? Join Tableau Visionary and 2021 Iron Viz champion Lisa Trescott for time-saving tips and tricks to speed up your dashboard builds and go quickly from analysis to insight.

Maps + Tableau = Effective storytelling and actionable insights. Hear practical tips and design best practices to take your mapmaking to the next level with Tableau Visionary Professor Dennis Kao.

Tableau's Edward Beaurain and Bailey Ferrari sit down with Diane Mizota to unpack the biggest news and announcements from the Tableau Conference 2024 keynote.

It’s time to stop overlooking your dashboard’s design with the help of Tableau Visionary Priya Padham. Learn how to blend the aesthetics of data art with the functionality of business dashboards to unleash your data’s full potential.
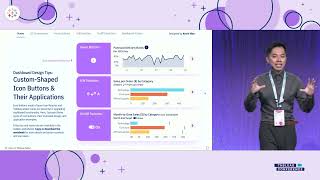
Upgrade your dashboards’ functions in Tableau with easy-to-make information buttons and toggle switches. Kevin Wee covers open-icon libraries, button and switch creations, interface design, and dashboard setups.

Identical twins and Tableau Visionaries Ken Flerlage and Kevin Flerlage return to Tableau Conference 2024 to share a ton of cool (new) stuff in Tableau that will take your dashboards to the next level.
In today's data-driven world, understanding statistical models is crucial for effective analysis and decision making. Whether you're a beginner or an experienced user, this book equips you with the foundational knowledge to grasp and implement statistical models within Tableau. Gain the confidence to speak fluently about the models you employ, driving adoption of your insights and analysis across your organization. As AI continues to revolutionize industries, possessing the skills to leverage statistical models is no longer optional—it's a necessity. Stay ahead of the curve and harness the full potential of your data by mastering the ability to interpret and utilize the insights generated by these models. Whether you're a data enthusiast, analyst, or business professional, this book empowers you to navigate the ever-evolving landscape of data analytics with confidence and proficiency. Start your journey toward data mastery today. In this book, you will learn: The basics of foundational statistical modeling with Tableau How to prove your analysis is statistically significant How to calculate and interpret confidence intervals Best practices for incorporating statistics into data visualizations How to connect external analytics resources from Tableau using R and Python
Join the analytics event of the year—watch the Tableau Conference Keynote.
The convergence of AI technology and the demand for trusted insights is fueling a new wave of data and innovation. Join Tableau on the journey as we build a future together.
Three data viz whizzes race the clock and battle dashboard-to-dashboard to create mind-blowing visualizations in Iron Viz—the world's ultimate data visualization competition. The Iron Viz finalists' visualizations are judged on design, analysis, and storytelling. Stream the data visualization showdown live from Tableau Conference 2024.
Install data analytics into your brain with this comprehensive introduction Data Analytics & Visualization All-in-One For Dummies collects the essential information on mining, organizing, and communicating data, all in one place. Clocking in at around 850 pages, this tome of a reference delivers eight books in one, so you can build a solid foundation of knowledge in data wrangling. Data analytics professionals are highly sought after these days, and this book will put you on the path to becoming one. You’ll learn all about sources of data like data lakes, and you’ll discover how to extract data using tools like Microsoft Power BI, organize the data in Microsoft Excel, and visually present the data in a way that makes sense using a Tableau. You’ll even get an intro to the Python, R, and SQL coding needed to take your data skills to a new level. With this Dummies guide, you’ll be well on your way to becoming a priceless data jockey. Mine data from data sources Organize and analyze data Use data to tell a story with Tableau Expand your know-how with Python and R New and novice data analysts will love this All-in-One reference on how to make sense of data. Get ready to watch as your career in data takes off.