talk-data.com talk-data.com

Topic

Polars

data_manipulation data_analysis rust

38

tagged

Activity Trend

13 peak/qtr
2020-Q1 2026-Q1

Activities

38 activities · Newest first

Time Series Analysis with Python Cookbook - Second Edition

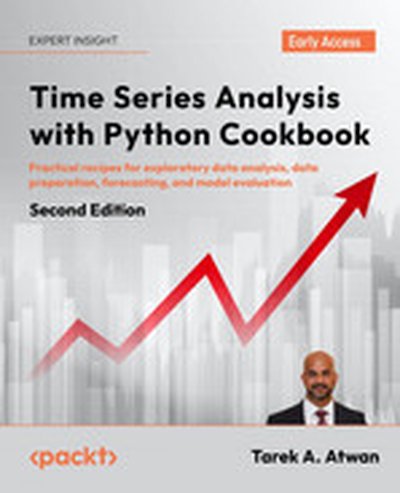
Perform time series analysis and forecasting confidently with this Python code bank and reference manual Purchase of the print or Kindle book includes a free PDF eBook Key Features Explore up-to-date forecasting and anomaly detection techniques using statistical, machine learning, and deep learning algorithms Learn different techniques for evaluating, diagnosing, and optimizing your models Work with a variety of complex data with trends, multiple seasonal patterns, and irregularities Book Description To use time series data to your advantage, you need to be well-versed in data preparation, analysis, and forecasting. This fully updated second edition includes chapters on probabilistic models and signal processing techniques, as well as new content on transformers. Additionally, you will leverage popular libraries and their latest releases covering Pandas, Polars, Sktime, stats models, stats forecast, Darts, and Prophet for time series with new and relevant examples. You'll start by ingesting time series data from various sources and formats, and learn strategies for handling missing data, dealing with time zones and custom business days, and detecting anomalies using intuitive statistical methods. Further, you'll explore forecasting using classical statistical models (Holt-Winters, SARIMA, and VAR). Learn practical techniques for handling non-stationary data, using power transforms, ACF and PACF plots, and decomposing time series data with multiple seasonal patterns. Then we will move into more advanced topics such as building ML and DL models using TensorFlow and PyTorch, and explore probabilistic modeling techniques. In this part, you’ll also learn how to evaluate, compare, and optimize models, making sure that you finish this book well-versed in wrangling data with Python. What you will learn Understand what makes time series data different from other data Apply imputation and interpolation strategies to handle missing data Implement an array of models for univariate and multivariate time series Plot interactive time series visualizations using hvPlot Explore state-space models and the unobserved components model (UCM) Detect anomalies using statistical and machine learning methods Forecast complex time series with multiple seasonal patterns Use conformal prediction for constructing prediction intervals for time series Who this book is for This book is for data analysts, business analysts, data scientists, data engineers, and Python developers who want practical Python recipes for time series analysis and forecasting techniques. Fundamental knowledge of Python programming is a prerequisite. Prior experience working with time series data to solve business problems will also help you to better utilize and apply the different recipes in this book.

Notebooks struggle when data vastly exceeds RAM: pagination hacks, fragile sampling, and surprise OOMs. Buckaroo is a modern data table for notebooks built to quickly make sense of dataframes by providing search, summary stats, and scrolling with every view. This talk reviews how Buckaroo uses out‑of‑core design patterns, viewport streaming, lazy Polars pipelines, batched background stats, and a series cache to make interactive exploration fast and reliable on commodity laptops. We’ll walk through the lifecycle of opening a large Parquet/CSV file: detecting formats, avoiding full materialization, fetching only requested row/column ranges, and throttling UI updates for smoothness. We’ll show how column‑level hashing (via a lightweight Rust extension) enables stable, cache keys so warm loads render the first viewport and stats in under a second. CSV specifics and a practical CSV→Parquet streaming path round out the approach. The ideas are tool‑agnostic and reproducible with the open‑source PyData stack; Buckaroo serves as a concrete reference implementation. You’ll leave with guidelines and snippets to bring these patterns to your own workflows.

Modern data pipelines are fast and expressive, but ensuring data quality is often not as straightforward. This talk introduces Paguro, an open-source, feature-rich validation and metadata library designed on top of the Polars DataFrame library. Paguro enables users to validate both single Data(Lazy)Frames and collections of Data(Lazy)Frames together, and provides beautifully formatted terminal diagnostics that explain why and where validation failed. Attendees will learn how to integrate the lightweight, fast, and composable validation toolkit into their workflows, from exploration to production, using a familiar Polars-native syntax.

PySpark’s Arrow-based Python UDFs open the door to dramatically faster data processing by avoiding expensive serialization overhead. At the same time, Polars, a high-performance DataFrame library built on Rust, offers zero-copy interoperability with Apache Arrow. This talk shows how combining these two technologies unlocks new performance gains: writing Arrow UDFs with Polars in PySpark can deliver performance speedups compared to Python UDFs. Attendees will learn how Arrow UDFs work in PySpark, how it can be used with other data processing libraries, and how to apply this approach to real-world Spark pipelines for faster, more efficient workloads.

Python is at the core of our analytics platform, which processes over 8,000 game records daily, each approximately 500 MB in size. Over the past two years, we have accumulated more than 200 TB of data, equivalent to 1,600 years of game time from over 7 million players—and our goal is to increase this user count tenfold. This talk will cover how we transitioned from Go and C++ parsers connected via PyBind to data frames in Python, how our analyses evolved from Pandas to Polars, and why we migrated our backend from Django to FastAPI. Finally, we will share our real-world experience with performance optimization, leveraging RabbitMQ, Redis, and process monitoring in an environment where Python bridges the worlds of game data and AI analysis.

How to do real TDD in data science? A journey from pandas to polars with pelage!

In the world of data, inconsistencies or inaccuracies often presents a major challenge to extract valuable insights. Yet the number of robust tools and practices to address those issues remain limited. Particularly, the practice of TDD remains quite difficult in data science, while it is a standard among classic software development, also because of poorly adapted tools and frameworks.

To address this issue we released Pelage, an open-source Python package to facilitate data exploration and testing, which relies on Polars intuitive syntax and speed. Pelage empowers data scientists and analysts to facilitate data transformation, enhance data quality and improve code clarity.

We will demonstrate, in a test-first approach, how you can use this library in a meaningful data science workflow to gain greater confidence for your data transformations.

See website: https://alixtc.github.io/pelage/

Advanced Polars: Lazy Queries and Streaming Mode

Do you find yourself struggling with Pandas' limitations when handling massive datasets or real-time data streams?

Discover Polars, the lightning-fast DataFrame library built in Rust. This talk presents two advanced features of the next-generation dataframe library: lazy queries and streaming mode.

Lazy evaluation in Polars allows you to build complex data pipelines without the performance bottlenecks of eager execution. By deferring computation, Polars optimises your queries using techniques like predicate and projection pushdown, reducing unnecessary computations and memory overhead. This leads to significant performance improvements, particularly with datasets larger than your system’s physical memory.

Polars' LazyFrames form the foundation of the library’s streaming mode, enabling efficient streaming pipelines, real-time transformations, and seamless integration with various data sinks.

This session will explore use cases and technical implementations of both lazy queries and streaming mode. We’ll also include live-coding demonstrations to introduce the tool, showcase best practices, and highlight common pitfalls.

Attendees will walk away with practical knowledge of lazy queries and streaming mode, ready to apply these tools in their daily work as data engineers or data scientists.

In this talk, we will introduce Ordeq, a cutting-edge data pipeline development framework used by data engineers, scientists and analysts across ING. Ordeq helps you modularise pipeline logic and abstract IO, elevating projects from proof-of-concepts to maintainable production-level applications. We will demonstrate how Ordeq integrates seamlessly with popular data processing tools like Spark, Polars, Matplotlib, DSPy, and orchestration tools such as Airflow. Additionally, we showcase how you can leverage Ordeq on public cloud offering like GCP. Ordeq has 0 dependencies and is available under MIT license.

Ever been burned by a mysterious slowdown in your data pipeline? In this session, we'll reveal how a stealthy performance regression in the Polars DataFrame library was hunted down and squashed. Using git bisect, Bash scripting, and uv, we automated commit compilation and benchmarking across two repos to pinpoint a commit that degraded multi-file Parquet loading. This led to challenging assumptions and rethinking performance monitoring for the Python data science library Polars.

Narwhals: enabling universal dataframe support

Ever tried passing a Polars Dataframe to a data science library and found that it...just works? No errors, no panics, no noticeable overhead, just...results? This is becoming increasingly common in 2025, yet only 2 years ago, it was mostly unheard of. So, what changed? A large part of the answer is: Narwhals.

Narwhals is a lightweight compatibility layer between dataframe libraries which lets your code work seamlessly across Polars, pandas, PySpark, DuckDB, and more! And it's not just a theoretical possibility: with ~30 million monthly downloads and set as a required dependency of Altair, Bokeh, Marimo, Plotly, Shiny, and more, it's clear that it's reshaping the data science landscape. By the end of the talk, you'll understand why writing generic dataframe code was such a headache (and why it isn't anymore), how Narwhals works and how its community operates, and how you can use it in your projects today. The talk will be technical yet accessible and light-hearted.

More than DataFrames: Data Pipelines with the Swiss Army Knife DuckDB

Most Python developers reach for Pandas or Polars when working with tabular data—but DuckDB offers a powerful alternative that’s more than just another DataFrame library. In this tutorial, you’ll learn how to use DuckDB as an in-process analytical database: building data pipelines, caching datasets, and running complex queries with SQL—all without leaving Python. We’ll cover common use cases like ETL, lightweight data orchestration, and interactive analytics workflows. You’ll leave with a solid mental model for using DuckDB effectively as the “SQLite for analytics.”

Explore Buckaroo, an open-source dataframe UI for pandas and polars that lets you scroll, search, and summarize dataframes directly in your notebook — no boilerplate code needed. You’ll learn how to use Buckaroo in daily workflows, from essential UI features to advanced capabilities like the low-code interface, dataframe diffing, automatic cleaning, and Pandera integration. This talk is aimed at data scientists with a basic understanding of pandas and Jupyter notebooks.

Extreme weather events threaten industries and economic stability. NOAA’s National Centers for Environmental Information (NCEI) addresses this through the Industry Proving Grounds (IPG), which modernizes data delivery by collaborating with sectors like re/insurance and retail to develop practical, data-driven solutions. This presentation explores IPG’s technical innovations, including implementing Polars for efficient data processing, AWS for scalability, and CI/CD pipelines for streamlined deployment. These tools enhance data accessibility, reduce latency, and support real-time decision-making. By integrating scientific computing, cloud technology, and DevOps, NCEI improves climate resilience and provides a model for leveraging open-source tools to address global challenges.

In Python, data analytics users often prioritize convenience, flexibility, and familiarity over pure performance. The cuDF DataFrame library provides a pandas-like experience with from 10x up to 50x performance improvements, but subtle differences prevent it from being a true drop-in replacement for many users. This talk will showcase the evolution of this library to provide zero-code change experiences, first for pandas users and now for Polars. We will provide examples of this usage and a high level overview of how users can make use of these today. We will then delve into the details of how GPU acceleration is implemented differently in pandas and Polars, along with a deep dive into some of the different technical challenges encountered for each. This talk will have something for both data practitioners and library developers.

User guides are the piece you often hit right after clicking the "Learn" or "Get Started" button in a package's documentation. They're responsible for onboarding new users, and providing a learning path through a package. Surprisingly, while pieces of documentation like the API Reference tend to be the same, the design of user guides tend to differ across packages.

In this talk, I'll discuss how to design an effective user guide for open source software. I'll explain how the guides for Polars, DuckDB, and FastAPI balance working end-to-end like a course, with being browsable like a reference.

Data manipulation libraries like Polars allow us to analyze and process data much faster than with native Python, but that’s only true if you know how to use them properly. When the team working on NCEI's Global Summary of the Month first integrated Polars, they found it was actually slower than the original Java version. In this talk, we'll discuss how our team learned how to think about computing problems like spreadsheet programmers, increasing our products’ processing speed by over 80%. We’ll share tips for rewriting legacy code to take advantage of parallel processing. We’ll also cover how we created custom, pre-compiled functions with Numba when the business requirements were too complex for native Polars expressions.

Structured Query Language (or SQL for short) is a programming language to manage data in a database system and an essential part of any data engineer’s tool kit. In this tutorial, you will learn how to use SQL to create databases, tables, insert data into them and extract, filter, join data or make calculations using queries. We will use DuckDB, a new open source embedded in-process database system that combines cutting edge database research with dataframe-inspired ease of use. DuckDB is only a pip install away (with zero dependencies), and runs right on your laptop. You will learn how to use DuckDB with your existing Python tools like Pandas, Polars, and Ibis to simplify and speed up your pipelines. Lastly, you will learn how to use SQL to create fast, interactive data visualizations, and how to teach your data how to fly and share it via the Cloud.