talk-data.com talk-data.com

Topic

KPI

Key Performance Indicator (KPI)

metrics performance_measurement business_analytics

109

tagged

Activity Trend

8 peak/qtr
2020-Q1 2026-Q1

Activities

109 activities · Newest first

Event Driven Real-Time Supply Chain Ecosystem Powered by Lakehouse

As the backbone of Australia’s supply chain, the Australia Rail Track Corporation (ARTC) plays a vital role in the management and monitoring of goods transportation across 8,500km of its rail network throughout Australia. ARTC provides weighbridges along their track which read train weights as they pass at speeds of up to 60 kilometers an hour. This information is highly valuable and is required both by ARTC and their customers to provide accurate haulage weight details, analyze technical equipment, and help ensure wagons have been loaded correctly.

A total of 750 trains run across a network of 8500 km in a day and generate real-time data at approximately 50 sensor platforms. With the help of structured streaming and Delta Lake, ARTC was able to analyze and store:

  • Precise train location
  • Weight of the train in real-time
  • Train crossing time to the second level
  • Train speed, temperature, sound frequency, and friction
  • Train schedule lookups

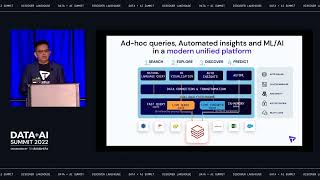
Once all the IoT data has been pulled together from an IoT event hub, it is processed in real-time using structured streaming and stored in Delta Lake. To understand the train GPS location, API calls are then made per minute per train from the Lakehouse. API calls are made in real-time to another scheduling system to lookup customer info. Once the processed/enriched data is stored in Delta Lake, an API layer was also created on top of it to expose this data to all consumers.

The outcome: increased transparency on weight data as it is now made available to customers; we built a digital data ecosystem that now ARTC’s customers use to meet their KPIs/ planning; the ability to determine temporary speed restrictions across the network to improve train scheduling accuracy and also schedule network maintenance based on train schedules and speed.

Talk by: Deepak Sekar and Harsh Mishra

Connect with us: Website: https://databricks.com Twitter: https://twitter.com/databricks LinkedIn: https://www.linkedin.com/company/databricks Instagram: https://www.instagram.com/databricksinc Facebook: https://www.facebook.com/databricksinc

We talked about:

Polina's background How common it is for PhD students to build ML pipelines end-to-end Simultaneous PhD and industry experience Support from both the academic and industry sides How common the industrial PhD setup is and how to get into one Organizational trust theory How price relates to trust How trust relates to explainability The importance of actionability Explainability vs interpretability vs actionability Complex glass box models Does the explainability of a model follow explainability? What explainable AI bring to customers and end users Can all trust be turned into KPI?

Links:

LinkedIn: https://www.linkedin.com/in/polina-mosolova/ Neural Additive Models paper: https://proceedings.neurips.cc/paper/2021/file/251bd0442dfcc53b5a761e050f8022b8-Paper.pdf Neural Basis Model paper: https://arxiv.org/pdf/2205.14120.pdf Interpretable Feature Spaces paper: https://kdd.org/exploration_files/vol24issue1_1._Interpretable_Feature_Spaces_revised.pdf

Demand Forecasting Best Practices

Lead your demand planning process to excellence and deliver real value to your supply chain. In Demand Forecasting Best Practices you’ll learn how to: Lead your team to improve quality while reducing workload Properly define the objectives and granularity of your demand planning Use intelligent KPIs to track accuracy and bias Identify areas for process improvement Help planners and stakeholders add value Determine relevant data to collect and how best to collect it Utilize different statistical and machine learning models An expert demand forecaster can help an organization avoid overproduction, reduce waste, and optimize inventory levels for a real competitive advantage. Demand Forecasting Best Practices teaches you how to become that virtuoso demand forecaster. This one-of-a-kind guide reveals forecasting tools, metrics, models, and stakeholder management techniques for delivering more effective supply chains. Everything you learn has been proven and tested in a live business environment. Discover author Nicolas Vandeput’s original five step framework for demand planning excellence and learn how to tailor it to your own company’s needs. Illustrations and real-world examples make each concept easy to understand and easy to follow. You’ll soon be delivering accurate predictions that are driving major business value. About the Technology An expert demand forecaster can help an organization avoid overproduction, reduce waste, and optimize inventory levels for a real competitive advantage. This book teaches you how to become that virtuoso demand forecaster. About the Book Demand Forecasting Best Practices reveals forecasting tools, metrics, models, and stakeholder management techniques for managing your demand planning process efficiently and effectively. Everything you learn has been proven and tested in a live business environment. Discover author Nicolas Vandeput’s original five step framework for demand planning excellence and learn how to tailor it to your own company’s needs. Illustrations and real-world examples make each concept easy to understand and easy to follow. You’ll soon be delivering accurate predictions that are driving major business value. What's Inside Enhance forecasting quality while reducing team workload Utilize intelligent KPIs to track accuracy and bias Identify process areas for improvement Assist stakeholders in sales, marketing, and finance Optimize statistical and machine learning models About the Reader For demand planners, sales and operations managers, supply chain leaders, and data scientists. About the Author Nicolas Vandeput is a supply chain data scientist, the founder of consultancy company SupChains in 2016, and a teacher at CentraleSupélec, France. Quotes This new book continues to push the FVA mindset, illustrating practices that drive the efficiency and effectiveness of the business forecasting process. - Michael Gilliland, Editor-in-Chief, Foresight: Journal of Applied Forecasting A must-read for any SCM professional, data scientist, or business owner. It's practical, accessible, and packed with valuable insights. - Edouard Thieuleux, Founder of AbcSupplyChain An exceptional resource that covers everything from basic forecasting principles to advanced forecasting techniques using artificial intelligence and machine learning. The writing style is engaging, making complex concepts accessible to both beginners and experts. - Daniel Stanton, Mr. Supply Chain® Nicolas did it again! Demand Forecasting Best Practices provides practical and actionable advice for improving the demand planning process. - Professor Spyros Makridakis, The Makridakis Open Forecasting Center, Institute For the Future (IFF), University of Nicosia This book is now my companion on all of our planning and forecasting projects. A perfect foundation for implementation and also to recommend process improvements. - Werner Nindl, Chief Architect – CPM Practice Director, Pivotal Drive This author understands the nuances of forecasting, and is able to explain them well. - Burhan Ul Haq, Director of Products, Enablers Both broader and deeper than I expected. - Maxim Volgin, Quantitative Marketing Manager, KLM Great book with actionable insights. - Simon Tschöke, Head of Research, German Edge Cloud

The Story of DevRel at Snowflake - How We Got Here | Snowflake

ABOUT THE TALK: In this talk, Felipe Hoffa and Daniel Myers present an honest take of their wildly different approaches to Developer Relations and how both have been critical in building Snowflake's world-class developer community and ecosystem from the ground up. Learn how they define DevRel KPIs & metrics and daily challenges they face and lessons learned along the way. You might even get inspired to become a Developer Advocate after understanding the different ways to engage with the Snowflake community and what's next for Snowflake Developer Relations.

ABOUT THE SPEAKERS: Felipe Hoffa is the Data Cloud Advocate at Snowflake. Previously he worked at Google, as a Developer Advocate on Data Analytics for BigQuery, after joining as a Software Engineer. He moved from Chile to San Francisco in 2011. His goal is to inspire developers and data scientists around the world to analyze and understand their data in ways they never could before.

Daniel Myers is in Developer Relations and previously held roles at different companies, including Google, Cisco, and Fujitsu. In addition, he led and founded multiple startups.

ABOUT DATA COUNCIL: Data Council (https://www.datacouncil.ai/) is a community and conference series that provides data professionals with the learning and networking opportunities they need to grow their careers.

Make sure to subscribe to our channel for the most up-to-date talks from technical professionals on data related topics including data infrastructure, data engineering, ML systems, analytics and AI from top startups and tech companies.

FOLLOW DATA COUNCIL: Twitter: https://twitter.com/DataCouncilAI LinkedIn: https://www.linkedin.com/company/datacouncil-ai/

Today I’m chatting with Osian Jones, Head of Product for the Data Platform at Stuart. Osian describes how impact and ROI can be difficult metrics to measure in a data platform, and how the team at Stuart has sought to answer this challenge. He also reveals how user experience is intrinsically linked to adoption and the technical problems that data platforms seek to solve. Throughout our conversation, Osian shares a holistic overview of what it was like to design a data platform from scratch, the lessons he’s learned along the way, and the advice he’d give to other data product managers taking on similar projects. 

Highlights/ Skip to:

Osian describes his role at Stuart (01:36) Brian and Osian explore the importance of creating an intentional user experience strategy (04:29) Osian explains how having a clear mission enables him to create parameters to measure product success (11:44) How Stuart developed the KPIs for their data platform (17:09) Osian gives his take on the pros and cons of how data departments are handled in regards to company oversight (21:23) Brian and Osian discuss how vital it is to listen to your end users rather than relying on analytics alone to measure adoption (26:50) Osian reveals how he and his team went about designing their platform (31:33) What Osian learned from building out the platform and what he would change if he had to tackle a data product like this all over again (36:34)

Quotes from Today’s Episode “Analytics has been treated very much as a technical problem, and very much so on the data platform side, which is more on the infrastructure and the tooling to enable analytics to take place. And so, viewing that purely as a technical problem left us at odds in a way, compared to [teams that had] a product leader, where the user was the focus [and] the user experience was very much driving a lot of what was roadmap.” — Osian Jones (03:15)

“Whenever we get this question of what’s the impact? What’s the value? How does it impact our company top line? How does it impact our company OKRs? This is when we start to panic sometimes, as data platform leaders because that’s an answer that’s really challenging for us, simply because we are mostly enablers for analytics teams who are themselves enablers. It’s almost like there’s two different degrees away from the direct impact that your team can have.” — Osian Jones (12:45)

“We have to start with a very clear mission. And our mission is to empower everyone to make the best data-driven decisions as fast as possible. And so, hidden within there, that’s a function of reducing time to insight, it’s also about maximizing trust and obviously minimizing costs.” — Osian Jones (13:48)

“We can track [metrics like reliability, incidents, time to resolution, etc.], but also there is a perception aspect to that as well. We can’t underestimate the importance of listening to our users and qualitative data.” — Osian Jones (30:16)

“These were questions that I felt that I naturally had to ask myself as a product manager. … Understanding who our users are, what they are trying to do with data and what is the current state of our data platform—so those were the three main things that I really wanted to get to the heart of, and connecting those three things together.” – Osian Jones (35:29)

“The advice that I would give to anyone who is taking on the role of a leader of a data platform or a similar role is, you can easily get overwhelmed by just so many different use cases. And so, I would really encourage [leaders] to avoid that.” – Osian Jones (37:57)

“Really look at your data platform from an end-user perspective and almost think of it as if you were to put the data platform on a supermarket shelf, what would that look like? And so, for each of the different components, how would you market that in a single one-liner in terms of what can this do for me?” – Osian Jones (39:22)

Links Stuart: https://stuart.com/ Article on IIA: https://iianalytics.com/community/blog/how-to-build-a-data-platform-as-a-product-a-retrospective Experiencing Data Episode 80 with Doug Hubbard: https://designingforanalytics.com/resources/episodes/080-how-to-measure-the-impact-of-data-productsand-anything-else-with-forecasting-and-measurement-expert-doug-hubbard/ LinkedIn: https://www.linkedin.com/in/osianllwydjones/ Medium: https://medium.com/@osianllwyd

One of the toughest parts of any data project is experimentation, not just because you need to choose the right testing method to confirm the project’s effectiveness, but because you also need to make sure you are testing the right hypothesis and measuring the right KPIs to ensure you receive accurate results. One of the most effective methods for data experimentation is A/B testing, and Anjali Mehra, Senior Director of Product Analytics, Data Science, Experimentation, and Instrumentation at DocuSign, is no stranger to how A/B testing can impact multiple parts of any organization. Throughout her career, she has also worked in marketing analytics and customer analytics at companies like Shutterfly, Wayfair, and Constant Contact. Throughout the episode, we discuss DocuSign’s analytics goals, how A/B testing works, how to gamify data experimentation, how A/B testing helps with new initiative validation, examples of A/B testing with data projects, how organizations can get started with data experimentation, and much more.

We talked about:

Jekaterina’s background How Jekaterina started freelancing Jekaterina’s initial ways of getting freelancing clients How being a generalist helped Jekaterina’s career Connecting business and data How Jekaterina’s LinkedIn posts helped her get clients Jekaterina’s work in fundraising Cohorts and KPIs Improving communication between the data and business teams Motivating every link in the company’s chain The cons of freelancing Balancing projects and networking The importance of enjoying what you do Growing the client base In the office work vs working remotely Jekaterina’s advice who people who feel stuck Jekaterina’s resource recommendations

Links:

Jekaterina's LinkedIn: https://www.linkedin.com/in/jekaterina-kokatjuhha/

Join DataTalks.Club: https://datatalks.club/slack.html

podcast_episode
by Santosh Kanthethy (EverBright (subsidiary of NextEra Energy Resources)) , Mico Yuk (Data Storytelling Academy)

Data plays a vital role in helping companies develop a competitive advantage, but it's the data evangelist who gathers and leverages those insights to help organizations understand the story their data is telling them. Today, on Analytics on Fire, we discuss how to become a data evangelist with data storyteller, leader, and lifelong learner, Santosh Kanthethy. At the time of recording this episode, Santosh was the IT Technology Manager for NextEra Energy Resources. Now, he is Head of Data Analytics and the leader of a growing internal data visualization community at EverBright, a solar financing solutions company and a subsidiary of NextEra. Tuning in, you'll gain step-by-step instructions for becoming a rockstar data evangelist , including three things to consider before you get started. We also take a look at the top functions of an internal data visualization community, how to get your executive team on board, and how to overcome some of the challenges that data evangelists are likely to encounter along the way. For actionable insights into how to build a thriving community, transform data culture from the inside out, and more, make sure not to miss this episode!   In this episode, you'll learn: [06:16] More about NextEra, one of America's largest capital investors in infrastructure. [07:10] Defining what a data evangelist is and how the internal data visualization community at NextEra was born. [08:48] Why Santosh decided to nurture and grow this community and switch from IT to data. [09:55] What the game of cricket taught Santosh about being a team leader. [13:55] Three things to consider before becoming a data evangelist: the maturity of your organization, your curiosity, and your ability to create content. [19:16] How often the data community meets and some of the topics that come up. [20:50] The three core selling points of a data community for your company: consistency better decision making, and relevance. [24:19] Tips for obtaining essential executive buy-in and support. [26:52] Becoming tool-agnostic: how to evangelize the benefits of the practice, not the tool. [29:34] A look at membership and how to determine who joins your data community. [31:40] KPIs, WIGs, and OKRs to measure the success of your community. [34:13] How data evangelists can overcome resistance while building a community. [36:20] What percentage of technology budgets should be allocated to community, change management, and upskilling. [38:50] How Santosh is inspired by the people he interacts with on a daily basis. [0:43:21] How Santosh can help you visualize your fitness data from Garmin or Strava! For full show notes, and the links mentioned visit: https://bibrainz.com/podcast/89   Enjoyed the Show?  Please leave us a review on iTunes.

AI powered Assortment Planning Solution

For shop owners to maximize revenue, they need to ensure that the right products are available on the right shelf at the right time. So, how does one assort the right mix of products to make max profit & reduce inventory pressure? Today, these decisions are led by human knowledge of trends & inputs from salespeople. This is error prone and cannot scale with a growing product assortment & varying demand patterns. Mindtree has analyzed this problem and built a cloud-based AI/ML solution that provides contextual, real-time insights and optimizes inventory management. In this presentation, you will hear our solution approach to help global CPG organization, promote new products, increase demand across their product offerings and drive impactful insights. You will also learn about the technical solution architecture, orchestration of product and KPI generation using Databricks, AI/ML models, heterogenous cloud platform options for deployment and rollout, scale-up and scale-out options.

Connect with us: Website: https://databricks.com Facebook: https://www.facebook.com/databricksinc Twitter: https://twitter.com/databricks LinkedIn: https://www.linkedin.com/company/data... Instagram: https://www.instagram.com/databricksinc/

Improving Apache Spark Application Processing Time by Configurations, Code Optimizations, etc.

In this session, we'll go over several use-cases and describe the process of improving our spark structured streaming application micro-batch time from ~55 to ~30 seconds in several steps.

Our app is processing ~ 700 MB/s of compressed data, it has very strict KPIs, and it is using several technologies and frameworks such as: Spark 3.1, Kafka, Azure Blob Storage, AKS and Java 11.

We'll share our work and experience in those fields, and go over a few tips to create better Spark structured streaming applications.

The main areas that will be discussed are: Spark Configuration changes, code optimizations and the implementation of the Spark custom data source.

Connect with us: Website: https://databricks.com Facebook: https://www.facebook.com/databricksinc Twitter: https://twitter.com/databricks LinkedIn: https://www.linkedin.com/company/data... Instagram: https://www.instagram.com/databricksinc/

Deliver Faster Decision Intelligence From Your Lakehouse

Accelerate the path from data to decisions with the the Tellius AI-driven Decision Intelligence platform powered by Databricks Delta Lake. Empower business users and data teams to analyze data residing in the Delta Lake to understand what is happening in their business, uncover the reasons why metrics change, and get recommendations on how to impact outcomes. Learn how organizations derive value from Delta Lakehouse with a modern analytics experience that unifies guided insights, natural language search, and automated machine learning to speed up data-driven decision making at cloud scale.

In this session, we will showcase how customers: - Discover changes in KPIs and investigate the reasons why metrics change with AI-powered automated analysis - Empower business users and data analysts to iteratively explore data to identify trend drivers, uncover new customer segments, and surface hidden patterns in data - Simplify and speed-up analysis from massive datasets on Databrick Delta lake

Connect with us: Website: https://databricks.com Facebook: https://www.facebook.com/databricksinc Twitter: https://twitter.com/databricks LinkedIn: https://www.linkedin.com/company/data... Instagram: https://www.instagram.com/databricksinc/

Using Feast Feature Store with Apache Spark for Self-Served Data Sharing and Analysis for Streaming

In this presentation we will talk about how we will use available NER based sensitive data detection methods, automated record of activity processing on top of spark and feast for collaborative intelligent analytics & governed data sharing. Information sharing is the key to successful business outcomes but it's complicated by sensitive information both user centric and business centric.

Our presentation is motivated by the need to share key KPIs, outcomes for health screening data collected from various surveys to improve care and assistance. In particular, collaborative information sharing was needed to help with health data management, early detection and prevention of disease KPIs. We will present a framework or an approach we have used for these purposes.

Connect with us: Website: https://databricks.com Facebook: https://www.facebook.com/databricksinc Twitter: https://twitter.com/databricks LinkedIn: https://www.linkedin.com/company/data... Instagram: https://www.instagram.com/databricksinc/

For most ML-based SaaS companies, the need to fulfill each customer’s KPI will usually be addressed by matching a dedicated model. Along with the benefits of optimizing the model’s performance, a model per customer solution carries a heavy production complexity with it. In this manner, incorporating up-to-date data as well as new features and capabilities as part of a model’s retraining process can become a major production bottleneck. In this talk, we will see how Riskified scaled up modeling operations based on MLOps ideas, and focus on how we used Airflow as our ML pipeline orchestrator. We will dive into how we wrap Airflow as an internal service, the goals we started with, the obstacles along the way and finally - how we solved them. You will receive tools for how to set up your own Airflow-based continuous training ML pipeline, and how we adjusted it such that ML engineers and data scientists would be able to collaborate and work in parallel using the same pipeline.

Up and Running with DAX for Power BI: A Concise Guide for Non-Technical Users

Take a concise approach to learning how DAX, the function language of Power BI and PowerPivot, works. This book focuses on explaining the core concepts of DAX so that ordinary folks can gain the skills required to tackle complex data analysis problems. But make no mistake, this is in no way an introductory book on DAX. A number of the topics you will learn, such as the concepts of context transition and table expansion, are considered advanced and challenging areas of DAX. While there are numerous resources on DAX, most are written with developers in mind, making learning DAX appear an overwhelming challenge, especially for those who are coming from an Excel background or with limited coding experience. The reality is, to hit the ground running with DAX, it’s not necessary to wade through copious pages on rarified DAX functions and the technical aspects of the language. There are just a few mandatory concepts that must be fully understood before DAX can be mastered. Knowledge of everything else in DAX is built on top of these mandatory aspects. Author Alison Box has been teaching and working with DAX for over eight years, starting with DAX for PowerPivot, the Excel add-in, before moving into the Power BI platform. The guide you hold in your hands is an outcome of these years of experience explaining difficult concepts in a way that people can understand. Over the years she has refined her approach, distilling down the truth of DAX which is “you can take people through as many functions as you like, but it’s to no avail if they don’t truly understand how it all works.” You will learn to use DAX to gain powerful insights into your data by generating complex and challenging business intelligence calculations including, but not limited to: Calculations to control the filtering of information to gain better insight into the data that matters to you Calculations across dates such as comparing data for thesame period last year or the previous period Finding rolling averages and rolling totals Comparing data against targets and KPIs or against average and maximum values Using basket analysis, such as “of customers who bought product X who also bought product Y” Using “what if” analysis and scenarios Finding “like for like” sales Dynamically showing TopN/BottomN percent of customers or products by sales Finding new and returning customers or sales regions in each month or each year Who This Book Is For Excel users and non-technical users of varying levels of ability or anyone who wants to learn DAX for Power BI but lacks the confidence to do so

Today, I’m flying solo in order to introduce you to CED: my three-part UX framework for designing your ML / predictive / prescriptive analytics UI around trust, engagement, and indispensability. Why this, why now? I have had several people tell me that this has been incredibly helpful to them in designing useful, usable analytics tools and decision support applications. 

I have written about the CED framework before at the following link:

https://designingforanalytics.com/ced

There you will find an example of the framework put into a real-world context. In this episode, I wanted to add some extra color to what is discussed in the article. If you’re an individual contributor, the best part is that you don’t have to be a professional designer to begin applying this to your own data products. And for leaders of teams, you can use the ideas in CED as a “checklist” when trying to audit your team’s solutions in the design phase—before it’s too late or expensive to make meaningful changes to the solutions. 

CED is definitely easier to implement if you understand the basics of human-centered design, including research, problem finding and definition, journey mapping, consulting, and facilitation etc. If you need a step-by-step method to develop these foundational skills, my training program, Designing Human-Centered Data Products, might help. It comes in two formats: a Self-Guided Video Course and a bi-annual Instructor-Led Seminar.

Quotes from Today’s Episode “‘How do we visualize the data?’ is the wrong starting question for designing a useful decision support application. That makes all kinds of assumptions that we have the right information, that we know what the users' goals and downstream decisions are, and we know how our solution will make a positive change in the customer or users’ life.”- Brian (@rhythmspice) (02:07)

“The CED is a UX framework for designing analytics tools that drive decision-making. Three letters, three parts: Conclusions; C, Evidence: E, and Data: D. The tough pill for some technical leaders to swallow is that the application, tool or product they are making may need to present what I call a ‘conclusion’—or if you prefer, an ‘opinion.’ Why? Because many users do not want an ‘exploratory’ tool—even when they say they do. They often need an insight to start with, before exploration time  becomes valuable.” - Brian (@rhythmspice) (04:00)

“CED requires you to do customer and user research to understand what the meaningful changes, insights, and things that people want or need actually are. Well designed ‘Conclusions’—when experienced in an analytics tool using the CED framework—often manifest themselves as insights such as unexpected changes, confirmation of expected changes, meaningful change versus meaningful benchmarks, scoring how KPIs track to predefined and meaningful ranges, actionable recommendations, and next best actions. Sometimes these Conclusions are best experienced as charts and visualizations, but not always—and this is why visualizing the data rarely is the right place to begin designing the UX.” - Brian (@rhythmspice) (08:54)

“If I see another analytics tool that promises ‘actionable insights’ but is primarily experienced as a collection of gigantic data tables with 10, 20, or 30+ columns of data to parse, your design is almost certainly going to frustrate, if not alienate, your users. Not because all table UIs are bad, but because you’ve put a gigantic tool-time tax on the user, forcing them to derive what the meaningful conclusions should be.”   - Brian (@rhythmspice) (20:20)

Gordon Wong is on a mission. A long-time business intelligence leader who has led data & analytics teams at HubSpot and FitBit, Wong believes BI teams aren’t data-driven enough. He says BI leaders need to think of themselves as small businesses owners and aggressively court and manage customers. He says too many don’t have metrics to track customer engagement and usage. In short, BI teams need to eat their own dog food and build success metrics to guide their activities.

If you are a data or analytics leader, do you know the value your team contributes to the business? Do you have KPIs for business intelligence? Can you measure the impact of data and analytics endeavors in terms the business understands and respects? Too often BI and data leaders get caught up in technical details and fail to evaluate how their technical initiatives add value to the business. This wide-ranging interview with a BI veteran will shed light on how to run a successful BI shop.

podcast_episode
by Tim Wilson (Analytics Power Hour - Columbus (OH) , Moe Kiss (Canva) , Michael Helbling (Search Discovery)

How do we measure the performance of this podcast? With well-formulated KPIs, of course! With targets set for them. Since Tim is the taskmaster who insists we revisit our KPIs every year, we decided he would be our guest for this show, and Michael and Moe would take turns trying to stump him with impromptu role playing as difficult stakeholders in challenging scenarios. For complete show notes, including links to items mentioned in this episode and a transcript of the show, visit the show page.

Optimize Video Streaming Delivery

Media content today is increasingly streamed video, and this trend will only grow as the speed of consumer internet and video quality improve. Traditional video streaming platforms, such as Netflix and Hulu, now account for only a portion of this content as more and more live events are streamed over the internet. And consumer-generated content on video-based social networks such as Twitch and TikTok is now more accessible and gaining popularity. This report focuses on the current state of video delivery, including the challenges content providers face and the various solutions they're pursuing. The findings in this report are based on a recent survey conducted by Edgecast, a content delivery network (CDN) that helps companies accelerate and deliver static and dynamic content to end users around the world. You'll explore: The current state of video streaming, how it works, and how streams are delivered Responses from a survey of CDN users that produce video streams How content providers are addressing recent video streaming challenges How the information in this report can help you identify KPIs

podcast_episode
by Val Kroll , Julie Hoyer , Tim Wilson (Analytics Power Hour - Columbus (OH) , Moe Kiss (Canva) , Michael Helbling (Search Discovery)

One of our KPIs for the show is to keep the Topic Repeat Rate (TRR) below 1.2%. From carefully monitoring our show dashboard, we had an actionable insight: we could finally revisit episode #002. Conveniently, the topic of that show was dashboards, which explains the self-referential stemwinder of a description of this episode. That show was "a long, long time ago. We can still remember… when the dashboards used to make us smile." For complete show notes, including links to items mentioned in this episode and a transcript of the show, visit the show page.

We talked about:

Adam’s background Adam’s laser and data experience Metrics and why do we care about them Examples of metrics KPIs KPI examples Derived KPIs Creating metrics — grocery store example Metric efficiency North Star metrics Threshold metrics Health metrics Data team metrics Experiments: treatment and control groups Accelerate metrics and timeboxing

Links:

Domino's article about measuring value: http://blog.dominodatalab.com/measuring-data-science-business-value Adam's article about skills useful for data scientists: https://towardsdatascience.com/how-to-apply-your-hard-earned-data-science-skillset-812585e3cc06 Adam's article about standing out: https://towardsdatascience.com/how-to-stand-out-as-a-great-data-scientist-in-2021-3b7a732114a9

Join DataTalks.Club: https://datatalks.club/slack.html

Our events: https://datatalks.club/events.html