 talk-data.com
Topic
Analytics
data_analysis
insights
metrics
4552
tagged
Activity Trend
398
peak/qtr
2020-Q1
2026-Q2
Top Events
O'Reilly Data Science Books
528
O'Reilly Data Engineering Books
395
Moody's Talks - Inside Economics
283
Data Engineering Podcast
227
Data Career Podcast: Helping You Land a Data Analyst Job FAST
187
Data + AI Summit 2025
178
Databricks DATA + AI Summit 2023
170
The Analytics Power Hour
130
DataFramed
103
DATA MINER Big Data Europe Conference 2020
98
Secrets of Data Analytics Leaders
89
Dbt Coalesce 2024
87

Summary Data assets and the pipelines that create them have become critical production infrastructure for companies. This adds a requirement for reliability and management of up-time similar to application infrastructure. In this episode Francisco Alberini and Mei Tao share their insights on what incident management looks like for data platforms and the teams that support them.
Announcements
Hello and welcome to the Data Engineering Podcast, the show about modern data management When you’re ready to build your next pipeline, or want to test out the projects you hear about on the show, you’ll need somewhere to deploy it, so check out our friends at Linode. With their managed Kubernetes platform it’s now even easier to deploy and scale your workflows, or try out the latest Helm charts from tools like Pulsar and Pachyderm. With simple pricing, fast networking, object storage, and worldwide data centers, you’ve got everything you need to run a bulletproof data platform. Go to dataengineeringpodcast.com/linode today and get a $100 credit to try out a Kubernetes cluster of your own. And don’t forget to thank them for their continued support of this show! Atlan is a collaborative workspace for data-driven teams, like Github for engineering or Figma for design teams. By acting as a virtual hub for data assets ranging from tables and dashboards to SQL snippets & code, Atlan enables teams to create a single source of truth for all their data assets, and collaborate across the modern data stack through deep integrations with tools like Snowflake, Slack, Looker and more. Go to dataengineeringpodcast.com/atlan today and sign up for a free trial. If you’re a data engineering podcast listener, you get credits worth $3000 on an annual subscription RudderStack helps you build a customer data platform on your warehouse or data lake. Instead of trapping data in a black box, they enable you to easily collect customer data from the entire stack and build an identity graph on your warehouse, giving you full visibility and control. Their SDKs make event streaming from any app or website easy, and their state-of-the-art reverse ETL pipelines enable you to send enriched data to any cloud tool. Sign up free… or just get the free t-shirt for being a listener of the Data Engineering Podcast at dataengineeringpodcast.com/rudder. Are you looking for a structured and battle-tested approach for learning data engineering? Would you like to know how you can build proper data infrastructures that are built to last? Would you like to have a seasoned industry expert guide you and answer all your questions? Join Pipeline Academy, the worlds first data engineering bootcamp. Learn in small groups with likeminded professionals for 9 weeks part-time to level up in your career. The course covers the most relevant and essential data and software engineering topics that enable you to start your journey as a professional data engineer or analytics engineer. Plus we have AMAs with world-class guest speakers every week! The next cohort starts in April 2022. Visit dataengineeringpodcast.com/academy and apply now! Your host is Tobias Macey and today I’m interviewing Francisco Alberini and Mei Tao about patterns and practices for incident management in data teams
Interview
Introduction How did you get involved in the area of data management? Can you start by describing some of the ways that an "incident" can manifest in a data system?
At a high level, what are the steps and participants required to bring an incident to resolution?
The principle of incident management is familiar to application/site reliability teams. What is the current state of the art/adoption for these practices among data teams? What are the signals that teams should be monitoring to identify and alert on potential incidents?
Alerting is a subjective and nuanced practice, regardless of the context. What are some useful practices that you have seen and enacted to reduce alert fatigue
Summary Data and analytics are permeating every system, including customer-facing applications. The introduction of embedded analytics to an end-user product creates a significant shift in requirements for your data layer. The Pinot OLAP datastore was created for this purpose, optimizing for low latency queries on rapidly updating datasets with highly concurrent queries. In this episode Kishore Gopalakrishna and Xiang Fu explain how it is able to achieve those characteristics, their work at StarTree to make it more easily available, and how you can start using it for your own high throughput data workloads today.
Announcements
Hello and welcome to the Data Engineering Podcast, the show about modern data management When you’re ready to build your next pipeline, or want to test out the projects you hear about on the show, you’ll need somewhere to deploy it, so check out our friends at Linode. With their managed Kubernetes platform it’s now even easier to deploy and scale your workflows, or try out the latest Helm charts from tools like Pulsar and Pachyderm. With simple pricing, fast networking, object storage, and worldwide data centers, you’ve got everything you need to run a bulletproof data platform. Go to dataengineeringpodcast.com/linode today and get a $100 credit to try out a Kubernetes cluster of your own. And don’t forget to thank them for their continued support of this show! So now your modern data stack is set up. How is everyone going to find the data they need, and understand it? Select Star is a data discovery platform that automatically analyzes & documents your data. For every table in Select Star, you can find out where the data originated, which dashboards are built on top of it, who’s using it in the company, and how they’re using it, all the way down to the SQL queries. Best of all, it’s simple to set up, and easy for both engineering and operations teams to use. With Select Star’s data catalog, a single source of truth for your data is built in minutes, even across thousands of datasets. Try it out for free and double the length of your free trial today at dataengineeringpodcast.com/selectstar. You’ll also get a swag package when you continue on a paid plan. This episode is brought to you by Acryl Data, the company behind DataHub, the leading developer-friendly data catalog for the modern data stack. Open Source DataHub is running in production at several companies like Peloton, Optum, Udemy, Zynga and others. Acryl Data provides DataHub as an easy to consume SaaS product which has been adopted by several companies. Signup for the SaaS product today at dataengineeringpodcast.com/acryl Your host is Tobias Macey and today I’m interviewing Kishore Gopalakrishna and Xiang Fu about Apache Pinot and its applications for powering user-facing analytics
Interview
Introduction How did you get involved in the area of data management? Can you describe what Pinot is and the story behind it? What are the primary use cases that Pinot is designed to support? There are numerous OLAP engines available with varying tradeoffs and optimal use cases. What are the cases where Pinot is the preferred choice?
How does it compare to systems such as Clickhouse (for OLAP) or CubeJS/GoodData (for embedded analytics)?
How do the operational needs of a database engine change as you move from serving internal stakeholders to external end-users? Can you describe how Pinot is architected?
What were the key design elements that were necessary to support low-latency queries with high concurrency?
Can you describe a typical end-to-end architecture where Pinot will be used for embedded analytics?
What are some of the tools/technologies/platforms/design patterns that Pinot might replace or obviate?
What are some of the useful lessons related to data modeling that users of Pinot should consider?
What are some edge cases that they might encounter due to details of how the storage layer is architected? (e.g. data
by
Cris deRitis
,
Mark Zandi
(Moody's Analytics)
,
Dennis McGill
(Zelman & Associates)
,
Ivy Zelman
(Zelman & Associates)
Mark and Cris welcome two guests from Zelman & Associates, Ivy Zelman, CEO and Dennis McGill, Director of Research to discuss the state of housing and mortgage markets. Full episode transcript Follow Mark Zandi @MarkZandi, Ryan Sweet @RealTime_Econ and Cris deRitis on LinkedIn for additional insight.
Questions or Comments, please email us at [email protected]. We would love to hear from you. To stay informed and follow the insights of Moody's Analytics economists, visit Economic View.
by
Juan Pablo
We talked about:
Juan Pablo's Backround Data engineering resources Teaching calculus Transitioning to Analytics Data Analytics bootcamp Getting money while studying Going to meetups to get a job Looking for uncrowded doors Using LinkedIn Portfolio Talking to people on meetups Eight tips to get your first analytics job Consider contracts and temporary roles Getting experience with non-profits Create your own internship Networking Website for hosting a portfolio I’m a math teacher. What should I learn first? Analytics engineering Best suggestion: keep showing up Networking on online conferences Communication skills and being organized
Links:
Website: https://www.thatjuanpablo.com/ Twitter: https://twitter.com/thatjuanpablo BROKE teacher to FAANG engineer Twitter thread: https://twitter.com/thatjuanpablo/status/1475806246317875203 LinkedIn: https://www.linkedin.com/in/thatjuanpablo/
Join DataTalks.Club: https://datatalks.club/slack.html
Our events: https://datatalks.club/events.html

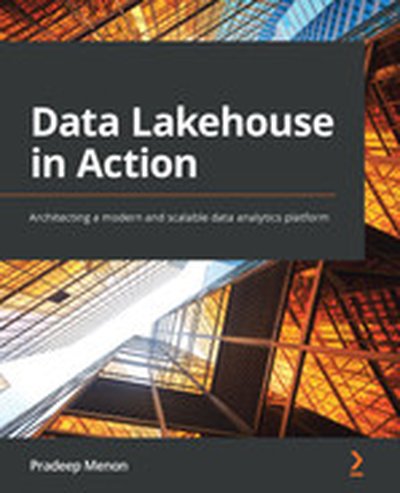
"Data Lakehouse in Action" provides a comprehensive exploration of the Data Lakehouse architecture, a modern solution for scalable and effective large-scale analytics. This book guides you through understanding the principles and components of the architecture, and its implementation using cloud platforms like Azure. Learn the practical techniques for designing robust systems tailored to organizational needs and maturity. What this Book will help me do Understand the evolution and need for modern data architecture patterns like Data Lakehouse. Learn how to design systems for data ingestion, storage, processing, and serving in a Data Lakehouse. Develop best practices for data governance and security in the Data Lakehouse architecture. Discover various analytics workflows enabled by the Data Lakehouse, including real-time and batch approaches. Implement practical Data Lakehouse patterns on a cloud platform, and integrate them with macro-patterns such as Data Mesh. Author(s) Pradeep Menon is a seasoned data architect and engineer with extensive experience implementing data analytics solutions for leading companies. With a penchant for simplifying complex architectures, Pradeep has authored several technical publications and frequently shares his expertise at industry conferences. His hands-on approach and passion for teaching shine through in his practical guides. Who is it for? This book is ideal for data professionals including architects, engineers, and data strategists eager to enhance their knowledge in modern analytics platforms. If you have a basic understanding of data architecture and are curious about implementing systems governed by the Data Lakehouse paradigm, this book is for you. It bridges foundational concepts with advanced practices, making it suitable for learners aiming to contribute effectively to their organization's analytics efforts.
Ever heard of ‘synthetic data’? Synthetic data is data that is artificially created (from statistical models), rather than generated by actual events. It contains all the characteristics of production data, minus the sensitive stuff. By 2024, 60% of the data used for the development of AI and analytics projects will be synthetically generated, according to Gartner. The reason organisations may use synthetic data over actual data is because you can get it more quickly, easily and cheaply. But there are concerns with this approach, because synthetic data is based on models and algorithms designed by humans and their biases. More data doesn’t necessarily equal better data. Is synthetic data a brilliant tool for improving data quality, reducing data acquisition costs, managing privacy and reducing overfitting? Or does synthetic data put us on a slippery slope of hard-to-interrogate models that are technically replacing fact with fiction? To answer these questions, I recently spoke to Minhaaj Rehman, who is CEO & Chief Data Scientist at Psyda, an AI-enabled academic and industrial research agency. In this episode of Leaders of Analytics, you will learn: What synthetic data is and how it is generatedThe most common uses for synthetic dataThe arguments for and against using synthetic dataWhen synthetic data is most helpful and when it is most riskyHow to implement best practices for mitigating the risks associated with synthetic data, and much more.Episode timestamps: 00:00 Intro 03:00 What Psyda Does 04:23 Academic Work and Modern Education 06:38 Getting into Data Science 11:30 What is Synthetic Data 13:30 Common Applications for Synthetic Data 18:50 Pros & Cons of using Synthetic Data 21:29 Risks of using Synthetic Data 23:48 When should Synthetic Data be Used 29:23 Synthetic Data is Cleaner than Real Data 34:05 Using Synthetic Data for Risk Mitigation 36:05 Resources on Learning More about Synthetic Data 38:05 Human Biases in Decision Making Connect with Minhaaj: Minhaaj on LinkedIn: https://www.linkedin.com/in/minhaaj/ Minhaaj's website and podcast: https://minhaaj.com/
Send us a text Want to be featured as a guest on Making Data Simple? Reach out to us at [[email protected]] and tell us why you should be next.
Abstract Hosted by Al Martin, VP, Data and AI Expert Services and Learning at IBM, Making Data Simple provides the latest thinking on big data, A.I., and the implications for the enterprise from a range of experts. This week on Making Data Simple, we have Nancy Hensley, Nancy is currently the Chief Marketing and Product Officer for Stats Perform. Nancy was the Chief Digital Officer at IBM.
Show Notes 1:37 – Nancy’s bio 3:10 - Are we talking Money Ball? 5:52 - On Base percentage 7:08 – Analyse examples 10:02 – Do you control the data? 11:24 – Out there statistics 14:12 - Can analytics go to far? 17:35 – Real time analysis 18:45 – Covid and sports 21:15 – Your role in sports betting 22:50 – What’s the most fascinating thing you’ve learned? 25:23 – What’s the future?
Website - Stats Perform Money Ball Stats Perform - Twitter Bill James – Baseball Abstract The Analyst Connect with the Team Producer Kate Brown - LinkedIn. Producer Steve Templeton - LinkedIn. Host Al Martin - LinkedIn and Twitter. Want to be featured as a guest on Making Data Simple? Reach out to us at [email protected] and tell us why you should be next. The Making Data Simple Podcast is hosted by Al Martin, WW VP Technical Sales, IBM, where we explore trending technologies, business innovation, and leadership ... while keeping it simple & fun.
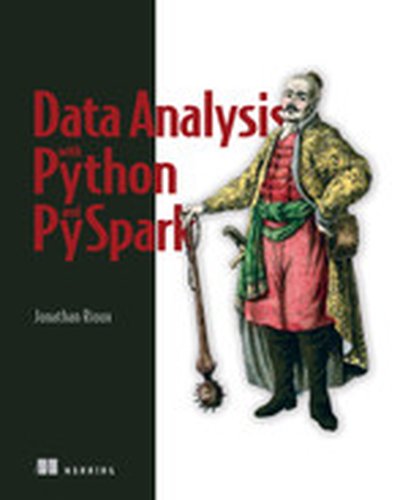
Think big about your data! PySpark brings the powerful Spark big data processing engine to the Python ecosystem, letting you seamlessly scale up your data tasks and create lightning-fast pipelines. In Data Analysis with Python and PySpark you will learn how to: Manage your data as it scales across multiple machines Scale up your data programs with full confidence Read and write data to and from a variety of sources and formats Deal with messy data with PySpark’s data manipulation functionality Discover new data sets and perform exploratory data analysis Build automated data pipelines that transform, summarize, and get insights from data Troubleshoot common PySpark errors Creating reliable long-running jobs Data Analysis with Python and PySpark is your guide to delivering successful Python-driven data projects. Packed with relevant examples and essential techniques, this practical book teaches you to build pipelines for reporting, machine learning, and other data-centric tasks. Quick exercises in every chapter help you practice what you’ve learned, and rapidly start implementing PySpark into your data systems. No previous knowledge of Spark is required. About the Technology The Spark data processing engine is an amazing analytics factory: raw data comes in, insight comes out. PySpark wraps Spark’s core engine with a Python-based API. It helps simplify Spark’s steep learning curve and makes this powerful tool available to anyone working in the Python data ecosystem. About the Book Data Analysis with Python and PySpark helps you solve the daily challenges of data science with PySpark. You’ll learn how to scale your processing capabilities across multiple machines while ingesting data from any source—whether that’s Hadoop clusters, cloud data storage, or local data files. Once you’ve covered the fundamentals, you’ll explore the full versatility of PySpark by building machine learning pipelines, and blending Python, pandas, and PySpark code. What's Inside Organizing your PySpark code Managing your data, no matter the size Scale up your data programs with full confidence Troubleshooting common data pipeline problems Creating reliable long-running jobs About the Reader Written for data scientists and data engineers comfortable with Python. About the Author As a ML director for a data-driven software company, Jonathan Rioux uses PySpark daily. He teaches the software to data scientists, engineers, and data-savvy business analysts. Quotes A clear and in-depth introduction for truly tackling big data with Python. - Gustavo Patino, Oakland University William Beaumont School of Medicine The perfect way to learn how to analyze and master huge datasets. - Gary Bake, Brambles Covers both basic and more advanced topics of PySpark, with a good balance between theory and hands-on. - Philippe Van Bergenl, P² Consulting For beginner to pro, a well-written book to help understand PySpark. - Raushan Kumar Jha, Microsoft
by
Tom Nichols
(Moody's Analytics)
,
Jesse Rogers
(Moody's Analytics)
,
Cris deRitis
,
Mark Zandi
(Moody's Analytics)
,
Chris Lafakis
,
Ryan Sweet
,
Juan Fuentes
(Moody's Analytics)
Mark, Ryan, and Cris welcome more Moody's Analytics colleagues to discuss energy commodity shortages due to the Russian invasion of Ukraine and how this effects the global economy. Follow Mark Zandi @MarkZandi, Ryan Sweet @RealTime_Econ and Cris deRitis on LinkedIn for additional insight.
Questions or Comments, please email us at [email protected]. We would love to hear from you. To stay informed and follow the insights of Moody's Analytics economists, visit Economic View.
Will the dream of a mythical database to handle all workloads (transactional + analytical) ever become a reality, or does it violate the laws of physics? This question sparked a hearty debate internally at dbt Labs, and Jon "Natty" Natkins joins Julia here to continue the conversation. Natty knows databases, and this episode will take you on a historical romp through the rise and fall of Hadoop, the transition to cloud data warehouses, and what's waiting for us next in database-land. For full show notes and to read 6+ years of back issues of the podcast's companion newsletter, head to https://roundup.getdbt.com. The Analytics Engineering Podcast is sponsored by dbt Labs.
Is AI good or bad? That would depend on how AI is applied. AI is a revolutionary capability with the power to do a lot of good and plenty of bad, on purpose or by omission. In order for AI to become a social good that improves our lives in broad terms, we must necessarily pick the right use cases and design solutions with a strong focus on ethics and privacy. So, how is AI being used for social good today, and how do we ensure the important topics of ethics and privacy are front and centre for those designing AI solutions? To answer these questions and many more relating to using data for good, I recently spoke to Dr Alex Antic. Alex is the Managing Director of the Dr Alex Antic Group and an award-winning data & analytics leader with a truly impressive CV spanning across quantitative finance, insurance, academia, several federal government departments and consulting as well as advisory and board roles. In this episode of Leaders of Analytics, we cover: The role data, data science and AI can and should play in societyExamples of how AI is being used for social goodHow public entities ensure people’s privacy is maintained, including the use of Privacy Enhancing TechnologiesThe most important data science and AI skills for us to foster as a societyHow Alex is teaching future data leaders to make ethical design choices, and much more.Dr Alex Antic website: https://dralexantic.com/ Dr Alex Antic LinkedIn profile: https://www.linkedin.com/in/dralexantic/
We're at an inflection point in data, where our data management solutions no longer match the complexity of organizations, the proliferation of data sources, and the scope of our aspirations to get value from data with AI and analytics. In this practical book, author Zhamak Dehghani introduces data mesh, a decentralized sociotechnical paradigm drawn from modern distributed architecture that provides a new approach to sourcing, sharing, accessing, and managing analytical data at scale. Dehghani guides practitioners, architects, technical leaders, and decision makers on their journey from traditional big data architecture to a distributed and multidimensional approach to analytical data management. Data mesh treats data as a product, considers domains as a primary concern, applies platform thinking to create self-serve data infrastructure, and introduces a federated computational model of data governance. Get a complete introduction to data mesh principles and its constituents Design a data mesh architecture Guide a data mesh strategy and execution Navigate organizational design to a decentralized data ownership model Move beyond traditional data warehouses and lakes to a distributed data mesh
Today, I’m flying solo in order to introduce you to CED: my three-part UX framework for designing your ML / predictive / prescriptive analytics UI around trust, engagement, and indispensability. Why this, why now? I have had several people tell me that this has been incredibly helpful to them in designing useful, usable analytics tools and decision support applications.
I have written about the CED framework before at the following link:
https://designingforanalytics.com/ced
There you will find an example of the framework put into a real-world context. In this episode, I wanted to add some extra color to what is discussed in the article. If you’re an individual contributor, the best part is that you don’t have to be a professional designer to begin applying this to your own data products. And for leaders of teams, you can use the ideas in CED as a “checklist” when trying to audit your team’s solutions in the design phase—before it’s too late or expensive to make meaningful changes to the solutions.
CED is definitely easier to implement if you understand the basics of human-centered design, including research, problem finding and definition, journey mapping, consulting, and facilitation etc. If you need a step-by-step method to develop these foundational skills, my training program, Designing Human-Centered Data Products, might help. It comes in two formats: a Self-Guided Video Course and a bi-annual Instructor-Led Seminar.
Quotes from Today’s Episode “‘How do we visualize the data?’ is the wrong starting question for designing a useful decision support application. That makes all kinds of assumptions that we have the right information, that we know what the users' goals and downstream decisions are, and we know how our solution will make a positive change in the customer or users’ life.”- Brian (@rhythmspice) (02:07)
“The CED is a UX framework for designing analytics tools that drive decision-making. Three letters, three parts: Conclusions; C, Evidence: E, and Data: D. The tough pill for some technical leaders to swallow is that the application, tool or product they are making may need to present what I call a ‘conclusion’—or if you prefer, an ‘opinion.’ Why? Because many users do not want an ‘exploratory’ tool—even when they say they do. They often need an insight to start with, before exploration time becomes valuable.” - Brian (@rhythmspice) (04:00)
“CED requires you to do customer and user research to understand what the meaningful changes, insights, and things that people want or need actually are. Well designed ‘Conclusions’—when experienced in an analytics tool using the CED framework—often manifest themselves as insights such as unexpected changes, confirmation of expected changes, meaningful change versus meaningful benchmarks, scoring how KPIs track to predefined and meaningful ranges, actionable recommendations, and next best actions. Sometimes these Conclusions are best experienced as charts and visualizations, but not always—and this is why visualizing the data rarely is the right place to begin designing the UX.” - Brian (@rhythmspice) (08:54)
“If I see another analytics tool that promises ‘actionable insights’ but is primarily experienced as a collection of gigantic data tables with 10, 20, or 30+ columns of data to parse, your design is almost certainly going to frustrate, if not alienate, your users. Not because all table UIs are bad, but because you’ve put a gigantic tool-time tax on the user, forcing them to derive what the meaningful conclusions should be.” - Brian (@rhythmspice) (20:20)
by
Gordon Wong
Gordon Wong is on a mission. A long-time business intelligence leader who has led data & analytics teams at HubSpot and FitBit, Wong believes BI teams aren’t data-driven enough. He says BI leaders need to think of themselves as small businesses owners and aggressively court and manage customers. He says too many don’t have metrics to track customer engagement and usage. In short, BI teams need to eat their own dog food and build success metrics to guide their activities.
If you are a data or analytics leader, do you know the value your team contributes to the business? Do you have KPIs for business intelligence? Can you measure the impact of data and analytics endeavors in terms the business understands and respects? Too often BI and data leaders get caught up in technical details and fail to evaluate how their technical initiatives add value to the business. This wide-ranging interview with a BI veteran will shed light on how to run a successful BI shop.
Summary When you think about selecting a database engine for your project you typically consider options focused on serving multiple concurrent users. Sometimes what you really need is an embedded database that is blazing fast for single user workloads. DuckDB is an in-process database engine optimized for OLAP applications to speed up your analytical queries that meets you where you are, whether that’s Python, R, Java, even the web. In this episode, Hannes Mühleisen, co-creator and CEO of DuckDB Labs, shares the motivations for creating the project, the myriad ways that it can be used to speed up your data projects, and the detailed engineering efforts that go into making it adaptable to any environment. This is a fascinating and humorous exploration of a truly useful piece of technology.
Announcements
Hello and welcome to the Data Engineering Podcast, the show about modern data management When you’re ready to build your next pipeline, or want to test out the projects you hear about on the show, you’ll need somewhere to deploy it, so check out our friends at Linode. With their managed Kubernetes platform it’s now even easier to deploy and scale your workflows, or try out the latest Helm charts from tools like Pulsar and Pachyderm. With simple pricing, fast networking, object storage, and worldwide data centers, you’ve got everything you need to run a bulletproof data platform. Go to dataengineeringpodcast.com/linode today and get a $100 credit to try out a Kubernetes cluster of your own. And don’t forget to thank them for their continued support of this show! Atlan is a collaborative workspace for data-driven teams, like Github for engineering or Figma for design teams. By acting as a virtual hub for data assets ranging from tables and dashboards to SQL snippets & code, Atlan enables teams to create a single source of truth for all their data assets, and collaborate across the modern data stack through deep integrations with tools like Snowflake, Slack, Looker and more. Go to dataengineeringpodcast.com/atlan today and sign up for a free trial. If you’re a data engineering podcast listener, you get credits worth $3000 on an annual subscription RudderStack helps you build a customer data platform on your warehouse or data lake. Instead of trapping data in a black box, they enable you to easily collect customer data from the entire stack and build an identity graph on your warehouse, giving you full visibility and control. Their SDKs make event streaming from any app or website easy, and their state-of-the-art reverse ETL pipelines enable you to send enriched data to any cloud tool. Sign up free… or just get the free t-shirt for being a listener of the Data Engineering Podcast at dataengineeringpodcast.com/rudder. Your host is Tobias Macey and today I’m interviewing Hannes Mühleisen about DuckDB, an in-process embedded database engine for columnar analytics
Interview
Introduction How did you get involved in the area of data management? Can you describe what DuckDB is and the story behind it? Where did the name come from? What are some of the use cases that DuckDB is designed to support? The interface for DuckDB is similar (at least in spirit) to SQLite. What are the deciding factors for when to use one vs. the other?
How might they be used in concert to take advantage of their relative strengths?
What are some of the ways that DuckDB can be used to better effect than options provided by different language ecosystems? Can you describe how DuckDB is implemented?
How has the design and goals of the project changed or evolved since you began working on it? What are some of the optimizations that you have had to make in order to support performant access to data that exceeds available memory?
Can you describe a typical workflow of incorporating DuckDB into an analytical project? What are some of the libraries/tools/systems that DuckDB might replace in the scope of a project or team? What are some of the
Summary Databases are an important component of application architectures, but they are often difficult to work with. HarperDB was created with the core goal of being a developer friendly database engine. In the process they ended up creating a scalable distributed engine that works across edge and datacenter environments to support a variety of novel use cases. In this episode co-founder and CEO Stephen Goldberg shares the history of the project, how it is architected to achieve their goals, and how you can start using it today.
Announcements
Hello and welcome to the Data Engineering Podcast, the show about modern data management When you’re ready to build your next pipeline, or want to test out the projects you hear about on the show, you’ll need somewhere to deploy it, so check out our friends at Linode. With their managed Kubernetes platform it’s now even easier to deploy and scale your workflows, or try out the latest Helm charts from tools like Pulsar and Pachyderm. With simple pricing, fast networking, object storage, and worldwide data centers, you’ve got everything you need to run a bulletproof data platform. Go to dataengineeringpodcast.com/linode today and get a $100 credit to try out a Kubernetes cluster of your own. And don’t forget to thank them for their continued support of this show! Today’s episode is Sponsored by Prophecy.io – the low-code data engineering platform for the cloud. Prophecy provides an easy-to-use visual interface to design & deploy data pipelines on Apache Spark & Apache Airflow. Now all the data users can use software engineering best practices – git, tests and continuous deployment with a simple to use visual designer. How does it work? – You visually design the pipelines, and Prophecy generates clean Spark code with tests on git; then you visually schedule these pipelines on Airflow. You can observe your pipelines with built in metadata search and column level lineage. Finally, if you have existing workflows in AbInitio, Informatica or other ETL formats that you want to move to the cloud, you can import them automatically into Prophecy making them run productively on Spark. Create your free account today at dataengineeringpodcast.com/prophecy. So now your modern data stack is set up. How is everyone going to find the data they need, and understand it? Select Star is a data discovery platform that automatically analyzes & documents your data. For every table in Select Star, you can find out where the data originated, which dashboards are built on top of it, who’s using it in the company, and how they’re using it, all the way down to the SQL queries. Best of all, it’s simple to set up, and easy for both engineering and operations teams to use. With Select Star’s data catalog, a single source of truth for your data is built in minutes, even across thousands of datasets. Try it out for free and double the length of your free trial today at dataengineeringpodcast.com/selectstar. You’ll also get a swag package when you continue on a paid plan. Are you looking for a structured and battle-tested approach for learning data engineering? Would you like to know how you can build proper data infrastructures that are built to last? Would you like to have a seasoned industry expert guide you and answer all your questions? Join Pipeline Academy, the worlds first data engineering bootcamp. Learn in small groups with likeminded professionals for 9 weeks part-time to level up in your career. The course covers the most relevant and essential data and software engineering topics that enable you to start your journey as a professional data engineer or analytics engineer. Plus we have AMAs with world-class guest speakers every week! The next cohort starts in April 2022. Visit dataengineeringpodcast.com/academy and apply now! Your host is Tobias Macey and today I’m interviewing Stephen Goldberg about HarperDB, a developer-friendly distributed database engine designed to scale acros